Immigrants from Colombia vs South American Indian In Labor Force | Age 30-34
COMPARE
Immigrants from Colombia
South American Indian
In Labor Force | Age 30-34
In Labor Force | Age 30-34 Comparison
Immigrants from Colombia
South American Indians
84.9%
IN LABOR FORCE | AGE 30-34
76.3/ 100
METRIC RATING
147th/ 347
METRIC RANK
84.7%
IN LABOR FORCE | AGE 30-34
52.1/ 100
METRIC RATING
169th/ 347
METRIC RANK
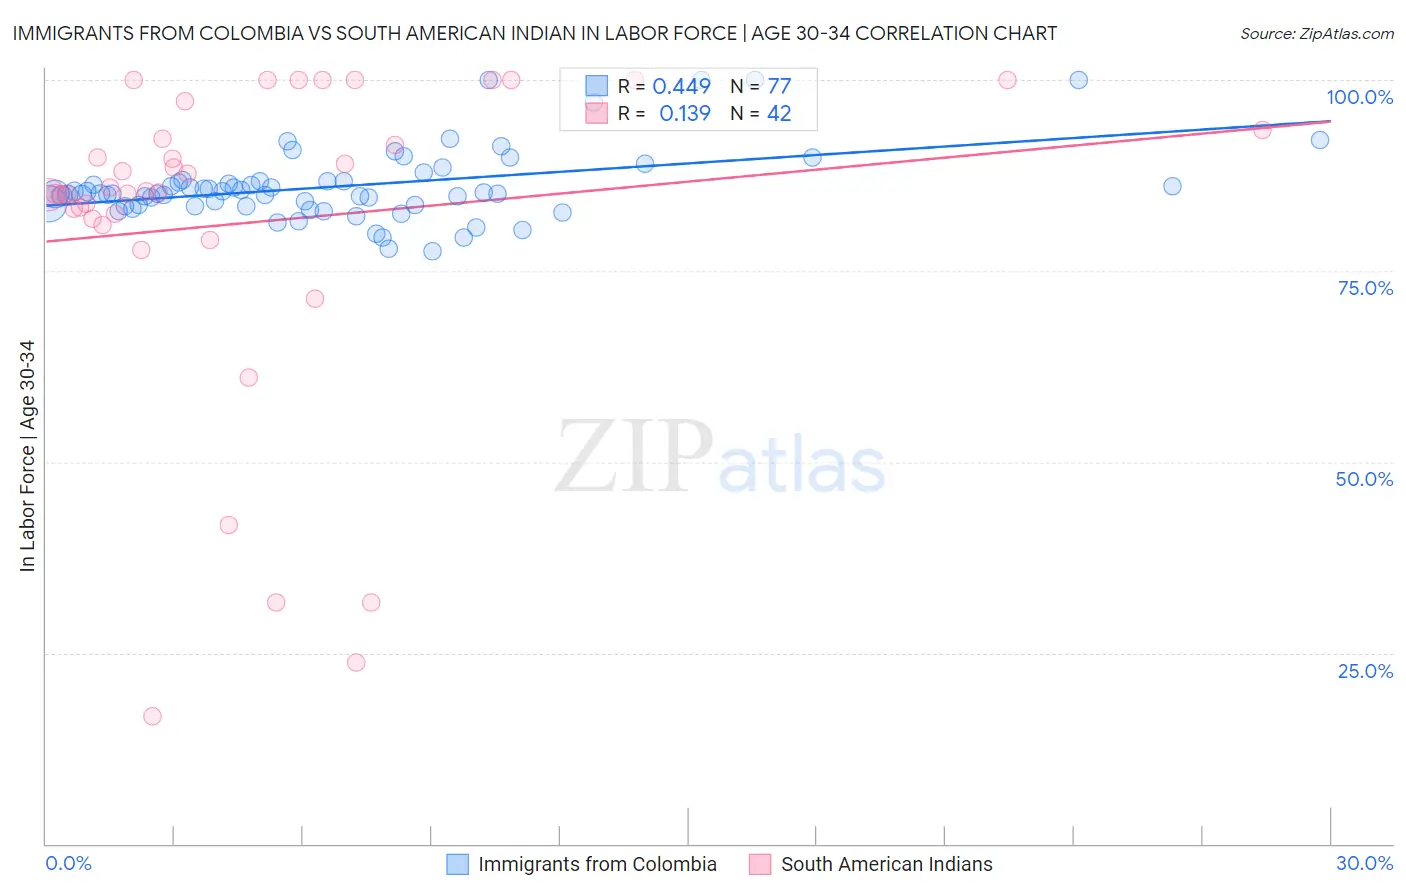
Immigrants from Colombia vs South American Indian In Labor Force | Age 30-34 Correlation Chart
The statistical analysis conducted on geographies consisting of 378,496,738 people shows a moderate positive correlation between the proportion of Immigrants from Colombia and labor force participation rate among population between the ages 30 and 34 in the United States with a correlation coefficient (R) of 0.449 and weighted average of 84.9%. Similarly, the statistical analysis conducted on geographies consisting of 164,535,874 people shows a poor positive correlation between the proportion of South American Indians and labor force participation rate among population between the ages 30 and 34 in the United States with a correlation coefficient (R) of 0.139 and weighted average of 84.7%, a difference of 0.19%.
In Labor Force | Age 30-34 Correlation Summary
| Measurement | Immigrants from Colombia | South American Indian |
| Minimum | 77.6% | 16.7% |
| Maximum | 100.0% | 100.0% |
| Range | 22.4% | 83.3% |
| Mean | 86.1% | 81.4% |
| Median | 85.1% | 85.3% |
| Interquartile 25% (IQ1) | 83.6% | 81.8% |
| Interquartile 75% (IQ3) | 86.8% | 93.5% |
| Interquartile Range (IQR) | 3.2% | 11.7% |
| Standard Deviation (Sample) | 4.7% | 21.4% |
| Standard Deviation (Population) | 4.6% | 21.1% |
Similar Demographics by In Labor Force | Age 30-34
Demographics Similar to Immigrants from Colombia by In Labor Force | Age 30-34
In terms of in labor force | age 30-34, the demographic groups most similar to Immigrants from Colombia are Immigrants from Saudi Arabia (84.9%, a difference of 0.0%), Immigrants from Pakistan (84.9%, a difference of 0.0%), Palestinian (84.9%, a difference of 0.010%), Immigrants from Ukraine (84.8%, a difference of 0.010%), and German (84.8%, a difference of 0.010%).
| Demographics | Rating | Rank | In Labor Force | Age 30-34 |
| Immigrants | Vietnam | 86.5 /100 | #140 | Excellent 85.0% |
| Chileans | 85.3 /100 | #141 | Excellent 84.9% |
| Immigrants | Indonesia | 84.3 /100 | #142 | Excellent 84.9% |
| Colombians | 82.2 /100 | #143 | Excellent 84.9% |
| Uruguayans | 78.5 /100 | #144 | Good 84.9% |
| Palestinians | 77.7 /100 | #145 | Good 84.9% |
| Immigrants | Saudi Arabia | 76.6 /100 | #146 | Good 84.9% |
| Immigrants | Colombia | 76.3 /100 | #147 | Good 84.9% |
| Immigrants | Pakistan | 76.2 /100 | #148 | Good 84.9% |
| Immigrants | Ukraine | 75.1 /100 | #149 | Good 84.8% |
| Germans | 75.1 /100 | #150 | Good 84.8% |
| Immigrants | Senegal | 74.0 /100 | #151 | Good 84.8% |
| Romanians | 73.5 /100 | #152 | Good 84.8% |
| Syrians | 70.1 /100 | #153 | Good 84.8% |
| Northern Europeans | 70.0 /100 | #154 | Good 84.8% |
Demographics Similar to South American Indians by In Labor Force | Age 30-34
In terms of in labor force | age 30-34, the demographic groups most similar to South American Indians are Immigrants from Peru (84.7%, a difference of 0.0%), Immigrants from Burma/Myanmar (84.7%, a difference of 0.0%), Irish (84.7%, a difference of 0.0%), Immigrants from England (84.7%, a difference of 0.0%), and Immigrants from South Eastern Asia (84.7%, a difference of 0.010%).
| Demographics | Rating | Rank | In Labor Force | Age 30-34 |
| South Americans | 58.7 /100 | #162 | Average 84.7% |
| Immigrants | Uruguay | 57.4 /100 | #163 | Average 84.7% |
| Icelanders | 56.8 /100 | #164 | Average 84.7% |
| Immigrants | Western Europe | 56.7 /100 | #165 | Average 84.7% |
| Afghans | 55.2 /100 | #166 | Average 84.7% |
| Immigrants | South Eastern Asia | 54.2 /100 | #167 | Average 84.7% |
| Immigrants | Peru | 52.4 /100 | #168 | Average 84.7% |
| South American Indians | 52.1 /100 | #169 | Average 84.7% |
| Immigrants | Burma/Myanmar | 52.0 /100 | #170 | Average 84.7% |
| Irish | 52.0 /100 | #171 | Average 84.7% |
| Immigrants | England | 51.7 /100 | #172 | Average 84.7% |
| Israelis | 51.1 /100 | #173 | Average 84.7% |
| Finns | 50.0 /100 | #174 | Average 84.7% |
| Immigrants | South America | 50.0 /100 | #175 | Average 84.7% |
| Immigrants | Uzbekistan | 49.1 /100 | #176 | Average 84.7% |