Immigrants from Africa vs Guatemalan In Labor Force | Age 16-19
COMPARE
Immigrants from Africa
Guatemalan
In Labor Force | Age 16-19
In Labor Force | Age 16-19 Comparison
Immigrants from Africa
Guatemalans
38.0%
IN LABOR FORCE | AGE 16-19
96.1/ 100
METRIC RATING
125th/ 347
METRIC RANK
35.5%
IN LABOR FORCE | AGE 16-19
8.6/ 100
METRIC RATING
219th/ 347
METRIC RANK
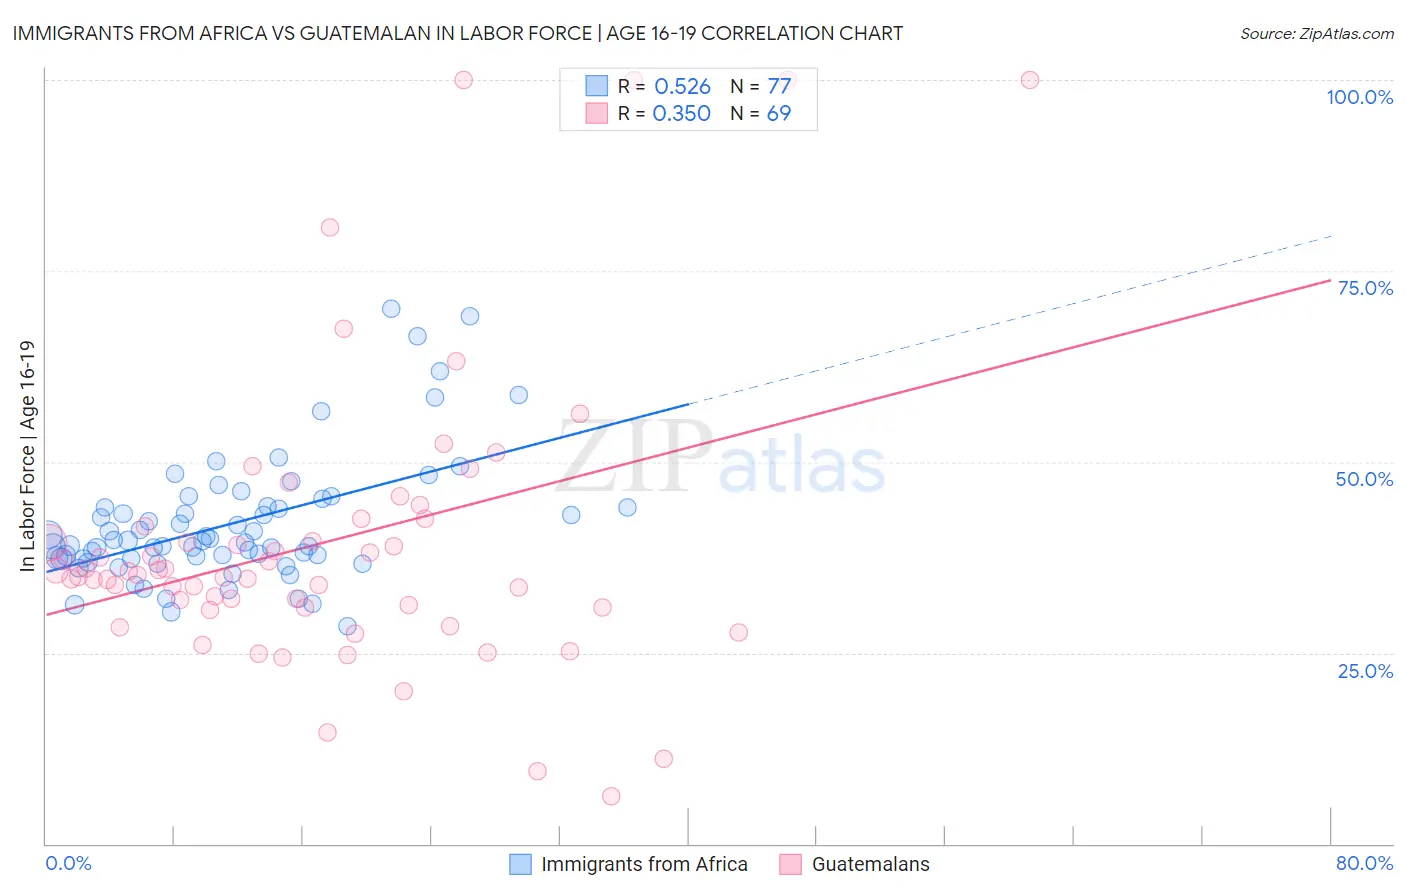
Immigrants from Africa vs Guatemalan In Labor Force | Age 16-19 Correlation Chart
The statistical analysis conducted on geographies consisting of 468,482,228 people shows a substantial positive correlation between the proportion of Immigrants from Africa and labor force participation rate among population between the ages 16 and 19 in the United States with a correlation coefficient (R) of 0.526 and weighted average of 38.0%. Similarly, the statistical analysis conducted on geographies consisting of 409,132,504 people shows a mild positive correlation between the proportion of Guatemalans and labor force participation rate among population between the ages 16 and 19 in the United States with a correlation coefficient (R) of 0.350 and weighted average of 35.5%, a difference of 7.2%.
In Labor Force | Age 16-19 Correlation Summary
| Measurement | Immigrants from Africa | Guatemalan |
| Minimum | 28.5% | 6.3% |
| Maximum | 70.1% | 100.0% |
| Range | 41.6% | 93.7% |
| Mean | 41.9% | 39.5% |
| Median | 39.6% | 35.2% |
| Interquartile 25% (IQ1) | 37.3% | 30.9% |
| Interquartile 75% (IQ3) | 44.1% | 42.1% |
| Interquartile Range (IQR) | 6.7% | 11.2% |
| Standard Deviation (Sample) | 8.3% | 19.2% |
| Standard Deviation (Population) | 8.3% | 19.1% |
Similar Demographics by In Labor Force | Age 16-19
Demographics Similar to Immigrants from Africa by In Labor Force | Age 16-19
In terms of in labor force | age 16-19, the demographic groups most similar to Immigrants from Africa are Immigrants from England (38.1%, a difference of 0.10%), African (38.0%, a difference of 0.16%), Choctaw (38.0%, a difference of 0.16%), New Zealander (38.0%, a difference of 0.17%), and Seminole (38.1%, a difference of 0.19%).
| Demographics | Rating | Rank | In Labor Force | Age 16-19 |
| Immigrants | Nepal | 97.8 /100 | #118 | Exceptional 38.3% |
| Assyrians/Chaldeans/Syriacs | 97.8 /100 | #119 | Exceptional 38.3% |
| Ukrainians | 97.6 /100 | #120 | Exceptional 38.3% |
| Ethiopians | 97.4 /100 | #121 | Exceptional 38.2% |
| Guamanians/Chamorros | 97.4 /100 | #122 | Exceptional 38.2% |
| Seminole | 96.7 /100 | #123 | Exceptional 38.1% |
| Immigrants | England | 96.4 /100 | #124 | Exceptional 38.1% |
| Immigrants | Africa | 96.1 /100 | #125 | Exceptional 38.0% |
| Africans | 95.6 /100 | #126 | Exceptional 38.0% |
| Choctaw | 95.6 /100 | #127 | Exceptional 38.0% |
| New Zealanders | 95.6 /100 | #128 | Exceptional 38.0% |
| Spaniards | 95.5 /100 | #129 | Exceptional 38.0% |
| Immigrants | Zimbabwe | 95.4 /100 | #130 | Exceptional 38.0% |
| Immigrants | Austria | 95.0 /100 | #131 | Exceptional 37.9% |
| Immigrants | Oceania | 94.7 /100 | #132 | Exceptional 37.9% |
Demographics Similar to Guatemalans by In Labor Force | Age 16-19
In terms of in labor force | age 16-19, the demographic groups most similar to Guatemalans are Immigrants from Bahamas (35.5%, a difference of 0.060%), Sri Lankan (35.5%, a difference of 0.18%), Turkish (35.4%, a difference of 0.23%), Immigrants from Ghana (35.4%, a difference of 0.24%), and Dutch West Indian (35.6%, a difference of 0.30%).
| Demographics | Rating | Rank | In Labor Force | Age 16-19 |
| Houma | 11.0 /100 | #212 | Poor 35.6% |
| Immigrants | Bolivia | 11.0 /100 | #213 | Poor 35.6% |
| Apache | 11.0 /100 | #214 | Poor 35.6% |
| Immigrants | South Eastern Asia | 10.8 /100 | #215 | Poor 35.6% |
| Dutch West Indians | 10.7 /100 | #216 | Poor 35.6% |
| Immigrants | Costa Rica | 10.7 /100 | #217 | Poor 35.6% |
| Sri Lankans | 9.8 /100 | #218 | Tragic 35.5% |
| Guatemalans | 8.6 /100 | #219 | Tragic 35.5% |
| Immigrants | Bahamas | 8.3 /100 | #220 | Tragic 35.5% |
| Turks | 7.3 /100 | #221 | Tragic 35.4% |
| Immigrants | Ghana | 7.3 /100 | #222 | Tragic 35.4% |
| Ghanaians | 6.5 /100 | #223 | Tragic 35.3% |
| Hondurans | 6.5 /100 | #224 | Tragic 35.3% |
| Immigrants | Belgium | 6.1 /100 | #225 | Tragic 35.3% |
| Immigrants | Guatemala | 5.7 /100 | #226 | Tragic 35.3% |