Immigrants from Africa vs Cree In Labor Force | Age 16-19
COMPARE
Immigrants from Africa
Cree
In Labor Force | Age 16-19
In Labor Force | Age 16-19 Comparison
Immigrants from Africa
Cree
38.0%
IN LABOR FORCE | AGE 16-19
96.1/ 100
METRIC RATING
125th/ 347
METRIC RANK
40.8%
IN LABOR FORCE | AGE 16-19
100.0/ 100
METRIC RATING
49th/ 347
METRIC RANK
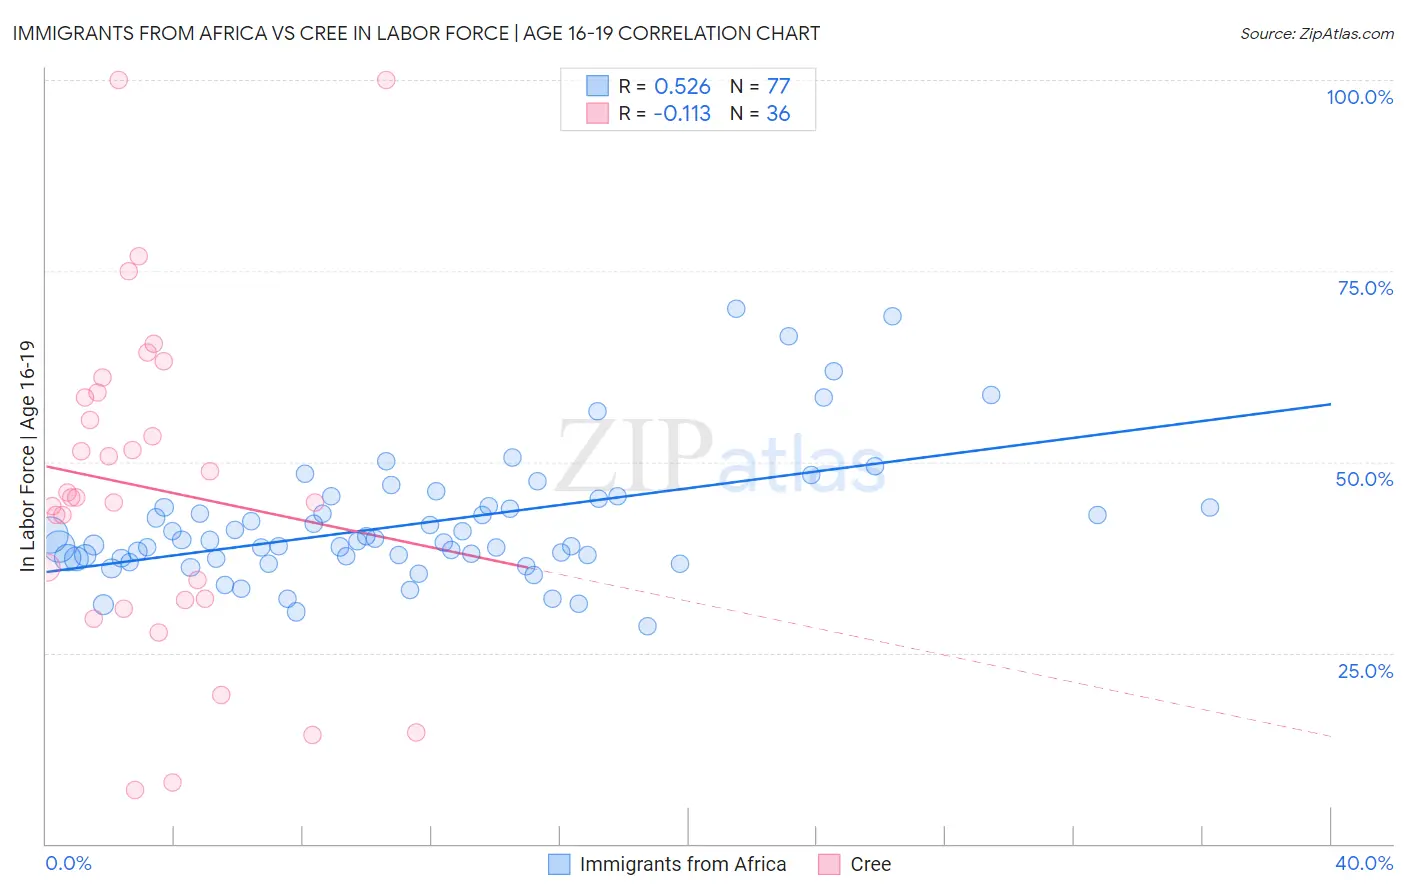
Immigrants from Africa vs Cree In Labor Force | Age 16-19 Correlation Chart
The statistical analysis conducted on geographies consisting of 468,482,228 people shows a substantial positive correlation between the proportion of Immigrants from Africa and labor force participation rate among population between the ages 16 and 19 in the United States with a correlation coefficient (R) of 0.526 and weighted average of 38.0%. Similarly, the statistical analysis conducted on geographies consisting of 76,173,738 people shows a poor negative correlation between the proportion of Cree and labor force participation rate among population between the ages 16 and 19 in the United States with a correlation coefficient (R) of -0.113 and weighted average of 40.8%, a difference of 7.2%.
In Labor Force | Age 16-19 Correlation Summary
| Measurement | Immigrants from Africa | Cree |
| Minimum | 28.5% | 7.1% |
| Maximum | 70.1% | 100.0% |
| Range | 41.6% | 92.9% |
| Mean | 41.9% | 46.6% |
| Median | 39.6% | 45.4% |
| Interquartile 25% (IQ1) | 37.3% | 32.0% |
| Interquartile 75% (IQ3) | 44.1% | 58.8% |
| Interquartile Range (IQR) | 6.7% | 26.8% |
| Standard Deviation (Sample) | 8.3% | 21.8% |
| Standard Deviation (Population) | 8.3% | 21.4% |
Similar Demographics by In Labor Force | Age 16-19
Demographics Similar to Immigrants from Africa by In Labor Force | Age 16-19
In terms of in labor force | age 16-19, the demographic groups most similar to Immigrants from Africa are Immigrants from England (38.1%, a difference of 0.10%), African (38.0%, a difference of 0.16%), Choctaw (38.0%, a difference of 0.16%), New Zealander (38.0%, a difference of 0.17%), and Seminole (38.1%, a difference of 0.19%).
| Demographics | Rating | Rank | In Labor Force | Age 16-19 |
| Immigrants | Nepal | 97.8 /100 | #118 | Exceptional 38.3% |
| Assyrians/Chaldeans/Syriacs | 97.8 /100 | #119 | Exceptional 38.3% |
| Ukrainians | 97.6 /100 | #120 | Exceptional 38.3% |
| Ethiopians | 97.4 /100 | #121 | Exceptional 38.2% |
| Guamanians/Chamorros | 97.4 /100 | #122 | Exceptional 38.2% |
| Seminole | 96.7 /100 | #123 | Exceptional 38.1% |
| Immigrants | England | 96.4 /100 | #124 | Exceptional 38.1% |
| Immigrants | Africa | 96.1 /100 | #125 | Exceptional 38.0% |
| Africans | 95.6 /100 | #126 | Exceptional 38.0% |
| Choctaw | 95.6 /100 | #127 | Exceptional 38.0% |
| New Zealanders | 95.6 /100 | #128 | Exceptional 38.0% |
| Spaniards | 95.5 /100 | #129 | Exceptional 38.0% |
| Immigrants | Zimbabwe | 95.4 /100 | #130 | Exceptional 38.0% |
| Immigrants | Austria | 95.0 /100 | #131 | Exceptional 37.9% |
| Immigrants | Oceania | 94.7 /100 | #132 | Exceptional 37.9% |
Demographics Similar to Cree by In Labor Force | Age 16-19
In terms of in labor force | age 16-19, the demographic groups most similar to Cree are Icelander (40.8%, a difference of 0.020%), Carpatho Rusyn (40.8%, a difference of 0.070%), Indonesian (40.7%, a difference of 0.16%), Immigrants from Zaire (40.7%, a difference of 0.26%), and Immigrants from Laos (40.6%, a difference of 0.34%).
| Demographics | Rating | Rank | In Labor Force | Age 16-19 |
| Whites/Caucasians | 100.0 /100 | #42 | Exceptional 41.3% |
| Tongans | 100.0 /100 | #43 | Exceptional 41.2% |
| Europeans | 100.0 /100 | #44 | Exceptional 41.1% |
| Croatians | 100.0 /100 | #45 | Exceptional 41.1% |
| Immigrants | Sudan | 100.0 /100 | #46 | Exceptional 41.0% |
| Carpatho Rusyns | 100.0 /100 | #47 | Exceptional 40.8% |
| Icelanders | 100.0 /100 | #48 | Exceptional 40.8% |
| Cree | 100.0 /100 | #49 | Exceptional 40.8% |
| Indonesians | 100.0 /100 | #50 | Exceptional 40.7% |
| Immigrants | Zaire | 100.0 /100 | #51 | Exceptional 40.7% |
| Immigrants | Laos | 100.0 /100 | #52 | Exceptional 40.6% |
| Immigrants | Kenya | 100.0 /100 | #53 | Exceptional 40.5% |
| Tlingit-Haida | 100.0 /100 | #54 | Exceptional 40.5% |
| British | 100.0 /100 | #55 | Exceptional 40.5% |
| Fijians | 100.0 /100 | #56 | Exceptional 40.4% |