Immigrants from Africa vs Australian In Labor Force | Age 16-19
COMPARE
Immigrants from Africa
Australian
In Labor Force | Age 16-19
In Labor Force | Age 16-19 Comparison
Immigrants from Africa
Australians
38.0%
IN LABOR FORCE | AGE 16-19
96.1/ 100
METRIC RATING
125th/ 347
METRIC RANK
37.8%
IN LABOR FORCE | AGE 16-19
93.2/ 100
METRIC RATING
136th/ 347
METRIC RANK
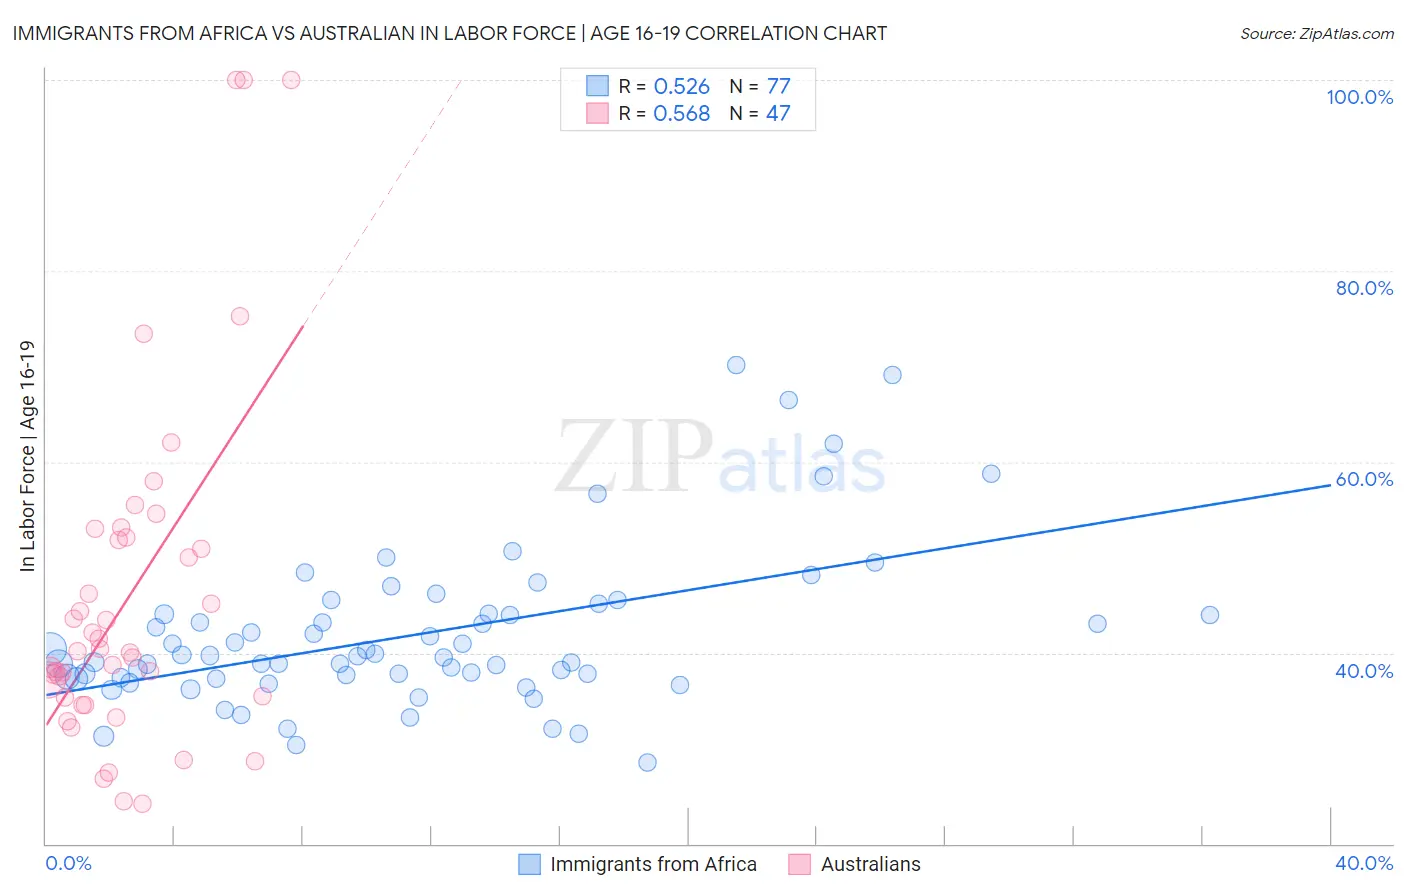
Immigrants from Africa vs Australian In Labor Force | Age 16-19 Correlation Chart
The statistical analysis conducted on geographies consisting of 468,482,228 people shows a substantial positive correlation between the proportion of Immigrants from Africa and labor force participation rate among population between the ages 16 and 19 in the United States with a correlation coefficient (R) of 0.526 and weighted average of 38.0%. Similarly, the statistical analysis conducted on geographies consisting of 223,900,853 people shows a substantial positive correlation between the proportion of Australians and labor force participation rate among population between the ages 16 and 19 in the United States with a correlation coefficient (R) of 0.568 and weighted average of 37.8%, a difference of 0.72%.
In Labor Force | Age 16-19 Correlation Summary
| Measurement | Immigrants from Africa | Australian |
| Minimum | 28.5% | 24.2% |
| Maximum | 70.1% | 100.0% |
| Range | 41.6% | 75.8% |
| Mean | 41.9% | 45.9% |
| Median | 39.6% | 40.1% |
| Interquartile 25% (IQ1) | 37.3% | 35.3% |
| Interquartile 75% (IQ3) | 44.1% | 52.1% |
| Interquartile Range (IQR) | 6.7% | 16.8% |
| Standard Deviation (Sample) | 8.3% | 18.1% |
| Standard Deviation (Population) | 8.3% | 17.9% |
Demographics Similar to Immigrants from Africa and Australians by In Labor Force | Age 16-19
In terms of in labor force | age 16-19, the demographic groups most similar to Immigrants from Africa are Immigrants from England (38.1%, a difference of 0.10%), African (38.0%, a difference of 0.16%), Choctaw (38.0%, a difference of 0.16%), New Zealander (38.0%, a difference of 0.17%), and Seminole (38.1%, a difference of 0.19%). Similarly, the demographic groups most similar to Australians are Cajun (37.8%, a difference of 0.0%), Macedonian (37.8%, a difference of 0.030%), Immigrants from Netherlands (37.8%, a difference of 0.090%), Comanche (37.7%, a difference of 0.23%), and Immigrants from Moldova (37.7%, a difference of 0.24%).
| Demographics | Rating | Rank | In Labor Force | Age 16-19 |
| Ukrainians | 97.6 /100 | #120 | Exceptional 38.3% |
| Ethiopians | 97.4 /100 | #121 | Exceptional 38.2% |
| Guamanians/Chamorros | 97.4 /100 | #122 | Exceptional 38.2% |
| Seminole | 96.7 /100 | #123 | Exceptional 38.1% |
| Immigrants | England | 96.4 /100 | #124 | Exceptional 38.1% |
| Immigrants | Africa | 96.1 /100 | #125 | Exceptional 38.0% |
| Africans | 95.6 /100 | #126 | Exceptional 38.0% |
| Choctaw | 95.6 /100 | #127 | Exceptional 38.0% |
| New Zealanders | 95.6 /100 | #128 | Exceptional 38.0% |
| Spaniards | 95.5 /100 | #129 | Exceptional 38.0% |
| Immigrants | Zimbabwe | 95.4 /100 | #130 | Exceptional 38.0% |
| Immigrants | Austria | 95.0 /100 | #131 | Exceptional 37.9% |
| Immigrants | Oceania | 94.7 /100 | #132 | Exceptional 37.9% |
| Cheyenne | 94.6 /100 | #133 | Exceptional 37.9% |
| Immigrants | Netherlands | 93.7 /100 | #134 | Exceptional 37.8% |
| Macedonians | 93.4 /100 | #135 | Exceptional 37.8% |
| Australians | 93.2 /100 | #136 | Exceptional 37.8% |
| Cajuns | 93.2 /100 | #137 | Exceptional 37.8% |
| Comanche | 91.9 /100 | #138 | Exceptional 37.7% |
| Immigrants | Moldova | 91.9 /100 | #139 | Exceptional 37.7% |
| Estonians | 91.7 /100 | #140 | Exceptional 37.7% |