Immigrants from Philippines vs Immigrants from Germany In Labor Force | Age 20-64
COMPARE
Immigrants from Philippines
Immigrants from Germany
In Labor Force | Age 20-64
In Labor Force | Age 20-64 Comparison
Immigrants from Philippines
Immigrants from Germany
79.8%
IN LABOR FORCE | AGE 20-64
78.0/ 100
METRIC RATING
147th/ 347
METRIC RANK
78.8%
IN LABOR FORCE | AGE 20-64
1.0/ 100
METRIC RATING
247th/ 347
METRIC RANK
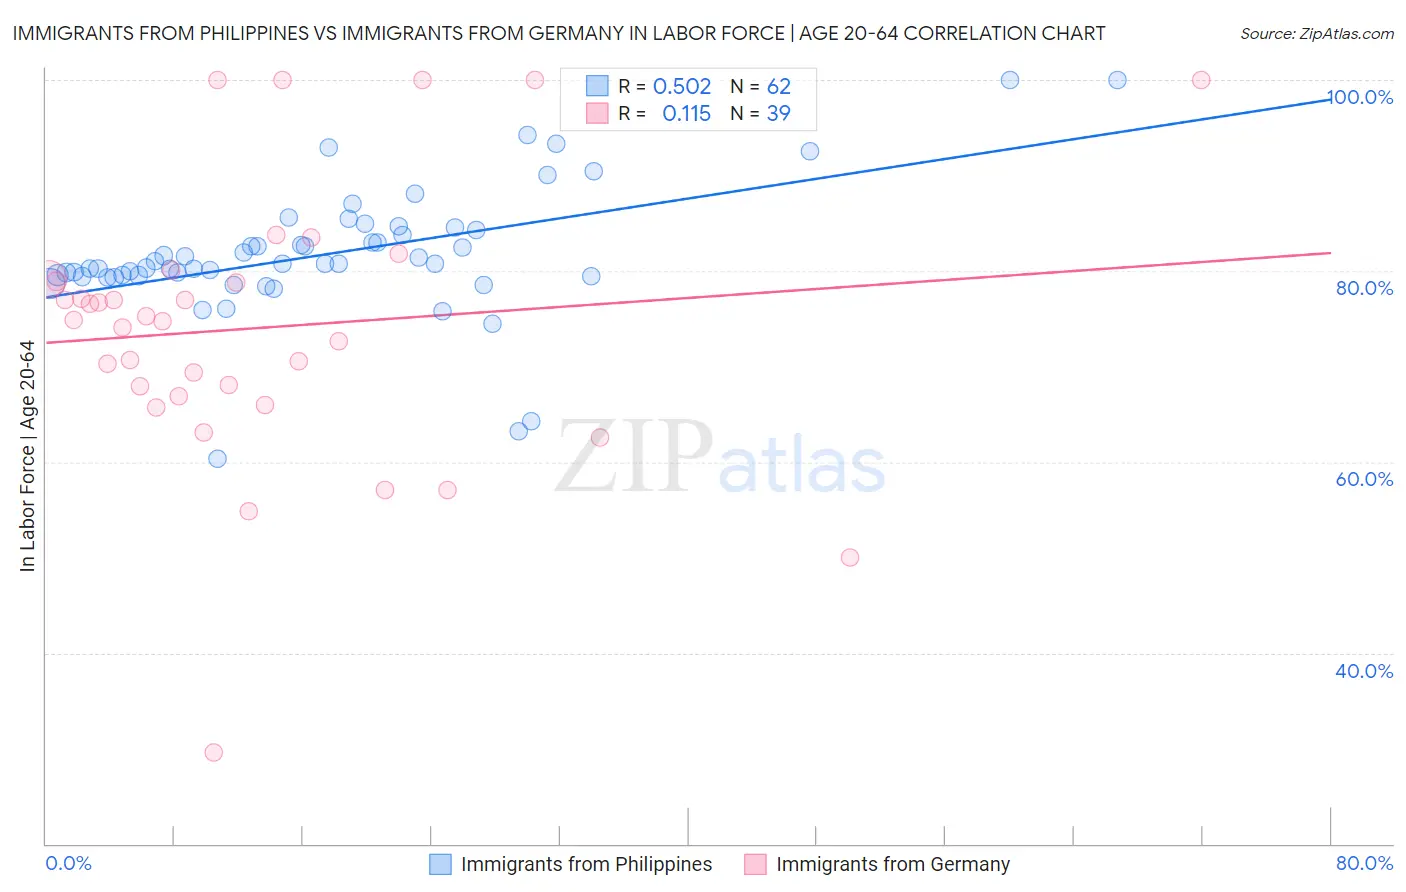
Immigrants from Philippines vs Immigrants from Germany In Labor Force | Age 20-64 Correlation Chart
The statistical analysis conducted on geographies consisting of 471,289,372 people shows a substantial positive correlation between the proportion of Immigrants from Philippines and labor force participation rate among population between the ages 20 and 64 in the United States with a correlation coefficient (R) of 0.502 and weighted average of 79.8%. Similarly, the statistical analysis conducted on geographies consisting of 463,888,599 people shows a poor positive correlation between the proportion of Immigrants from Germany and labor force participation rate among population between the ages 20 and 64 in the United States with a correlation coefficient (R) of 0.115 and weighted average of 78.8%, a difference of 1.2%.
In Labor Force | Age 20-64 Correlation Summary
| Measurement | Immigrants from Philippines | Immigrants from Germany |
| Minimum | 60.3% | 29.6% |
| Maximum | 100.0% | 100.0% |
| Range | 39.7% | 70.4% |
| Mean | 81.8% | 74.1% |
| Median | 80.8% | 74.9% |
| Interquartile 25% (IQ1) | 79.5% | 66.8% |
| Interquartile 75% (IQ3) | 84.3% | 79.1% |
| Interquartile Range (IQR) | 4.8% | 12.3% |
| Standard Deviation (Sample) | 6.9% | 14.4% |
| Standard Deviation (Population) | 6.8% | 14.2% |
Similar Demographics by In Labor Force | Age 20-64
Demographics Similar to Immigrants from Philippines by In Labor Force | Age 20-64
In terms of in labor force | age 20-64, the demographic groups most similar to Immigrants from Philippines are Romanian (79.8%, a difference of 0.0%), Immigrants from Southern Europe (79.8%, a difference of 0.010%), Immigrants from Israel (79.8%, a difference of 0.020%), Slovak (79.8%, a difference of 0.020%), and Immigrants from Sweden (79.8%, a difference of 0.020%).
| Demographics | Rating | Rank | In Labor Force | Age 20-64 |
| Immigrants | South Eastern Asia | 80.4 /100 | #140 | Excellent 79.8% |
| Immigrants | Israel | 80.0 /100 | #141 | Good 79.8% |
| Slovaks | 79.9 /100 | #142 | Good 79.8% |
| Immigrants | Sweden | 79.7 /100 | #143 | Good 79.8% |
| Koreans | 79.6 /100 | #144 | Good 79.8% |
| Pakistanis | 79.3 /100 | #145 | Good 79.8% |
| Immigrants | Southern Europe | 78.9 /100 | #146 | Good 79.8% |
| Immigrants | Philippines | 78.0 /100 | #147 | Good 79.8% |
| Romanians | 77.6 /100 | #148 | Good 79.8% |
| Icelanders | 75.1 /100 | #149 | Good 79.7% |
| Costa Ricans | 72.4 /100 | #150 | Good 79.7% |
| Scandinavians | 72.0 /100 | #151 | Good 79.7% |
| Immigrants | Northern Europe | 72.0 /100 | #152 | Good 79.7% |
| Immigrants | Kazakhstan | 69.5 /100 | #153 | Good 79.7% |
| New Zealanders | 69.4 /100 | #154 | Good 79.7% |
Demographics Similar to Immigrants from Germany by In Labor Force | Age 20-64
In terms of in labor force | age 20-64, the demographic groups most similar to Immigrants from Germany are Immigrants from Caribbean (78.8%, a difference of 0.010%), Immigrants from Trinidad and Tobago (78.8%, a difference of 0.020%), English (78.8%, a difference of 0.030%), Scottish (78.9%, a difference of 0.040%), and Honduran (78.8%, a difference of 0.040%).
| Demographics | Rating | Rank | In Labor Force | Age 20-64 |
| Trinidadians and Tobagonians | 2.3 /100 | #240 | Tragic 79.0% |
| Jamaicans | 2.0 /100 | #241 | Tragic 78.9% |
| Immigrants | Micronesia | 1.9 /100 | #242 | Tragic 78.9% |
| Immigrants | West Indies | 1.7 /100 | #243 | Tragic 78.9% |
| French | 1.5 /100 | #244 | Tragic 78.9% |
| Scottish | 1.3 /100 | #245 | Tragic 78.9% |
| Immigrants | Trinidad and Tobago | 1.1 /100 | #246 | Tragic 78.8% |
| Immigrants | Germany | 1.0 /100 | #247 | Tragic 78.8% |
| Immigrants | Caribbean | 1.0 /100 | #248 | Tragic 78.8% |
| English | 0.9 /100 | #249 | Tragic 78.8% |
| Hondurans | 0.8 /100 | #250 | Tragic 78.8% |
| Barbadians | 0.7 /100 | #251 | Tragic 78.8% |
| Immigrants | Honduras | 0.6 /100 | #252 | Tragic 78.7% |
| Basques | 0.5 /100 | #253 | Tragic 78.7% |
| Immigrants | Lebanon | 0.5 /100 | #254 | Tragic 78.7% |