Hungarian vs Dutch In Labor Force | Age 20-64
COMPARE
Hungarian
Dutch
In Labor Force | Age 20-64
In Labor Force | Age 20-64 Comparison
Hungarians
Dutch
79.2%
IN LABOR FORCE | AGE 20-64
7.2/ 100
METRIC RATING
221st/ 347
METRIC RANK
79.3%
IN LABOR FORCE | AGE 20-64
20.2/ 100
METRIC RATING
199th/ 347
METRIC RANK
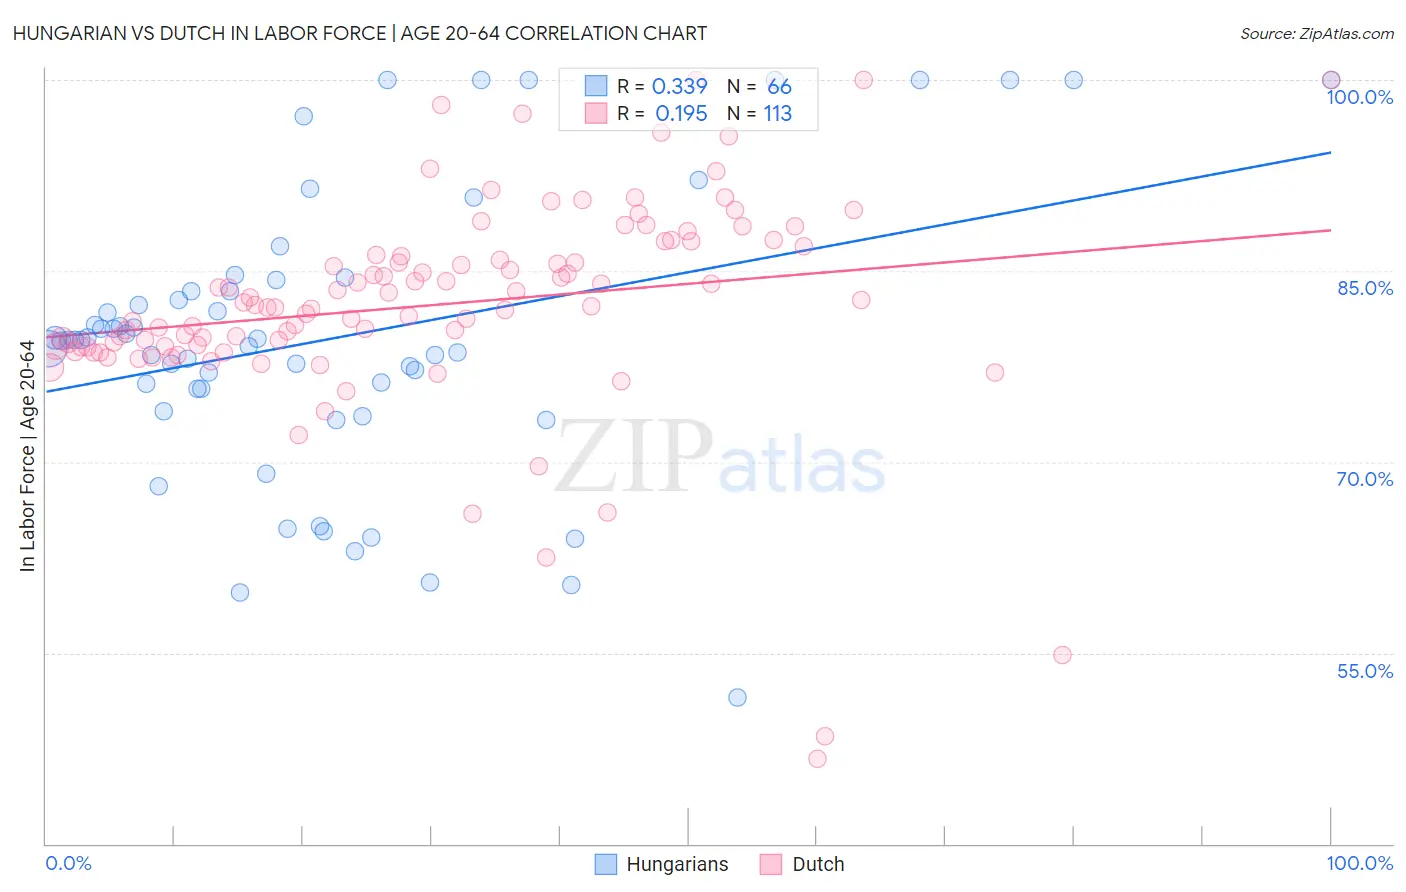
Hungarian vs Dutch In Labor Force | Age 20-64 Correlation Chart
The statistical analysis conducted on geographies consisting of 486,244,384 people shows a mild positive correlation between the proportion of Hungarians and labor force participation rate among population between the ages 20 and 64 in the United States with a correlation coefficient (R) of 0.339 and weighted average of 79.2%. Similarly, the statistical analysis conducted on geographies consisting of 554,361,515 people shows a poor positive correlation between the proportion of Dutch and labor force participation rate among population between the ages 20 and 64 in the United States with a correlation coefficient (R) of 0.195 and weighted average of 79.3%, a difference of 0.24%.
In Labor Force | Age 20-64 Correlation Summary
| Measurement | Hungarian | Dutch |
| Minimum | 51.5% | 46.7% |
| Maximum | 100.0% | 100.0% |
| Range | 48.5% | 53.3% |
| Mean | 79.7% | 82.3% |
| Median | 79.6% | 82.2% |
| Interquartile 25% (IQ1) | 75.8% | 79.1% |
| Interquartile 75% (IQ3) | 83.4% | 86.6% |
| Interquartile Range (IQR) | 7.6% | 7.5% |
| Standard Deviation (Sample) | 11.1% | 8.4% |
| Standard Deviation (Population) | 11.1% | 8.4% |
Similar Demographics by In Labor Force | Age 20-64
Demographics Similar to Hungarians by In Labor Force | Age 20-64
In terms of in labor force | age 20-64, the demographic groups most similar to Hungarians are Immigrants (79.2%, a difference of 0.010%), Immigrants from Panama (79.1%, a difference of 0.010%), Canadian (79.1%, a difference of 0.010%), Immigrants from Uzbekistan (79.1%, a difference of 0.010%), and French Canadian (79.2%, a difference of 0.030%).
| Demographics | Rating | Rank | In Labor Force | Age 20-64 |
| Immigrants | Armenia | 12.2 /100 | #214 | Poor 79.2% |
| Immigrants | Norway | 12.0 /100 | #215 | Poor 79.2% |
| Arabs | 11.4 /100 | #216 | Poor 79.2% |
| Immigrants | Western Asia | 11.0 /100 | #217 | Poor 79.2% |
| Immigrants | England | 9.3 /100 | #218 | Tragic 79.2% |
| French Canadians | 8.4 /100 | #219 | Tragic 79.2% |
| Immigrants | Immigrants | 7.7 /100 | #220 | Tragic 79.2% |
| Hungarians | 7.2 /100 | #221 | Tragic 79.2% |
| Immigrants | Panama | 6.9 /100 | #222 | Tragic 79.1% |
| Canadians | 6.8 /100 | #223 | Tragic 79.1% |
| Immigrants | Uzbekistan | 6.8 /100 | #224 | Tragic 79.1% |
| Portuguese | 6.4 /100 | #225 | Tragic 79.1% |
| Central Americans | 5.9 /100 | #226 | Tragic 79.1% |
| Immigrants | Western Europe | 5.9 /100 | #227 | Tragic 79.1% |
| Panamanians | 5.7 /100 | #228 | Tragic 79.1% |
Demographics Similar to Dutch by In Labor Force | Age 20-64
In terms of in labor force | age 20-64, the demographic groups most similar to Dutch are Immigrants from Oceania (79.3%, a difference of 0.010%), Immigrants from Laos (79.4%, a difference of 0.020%), Immigrants from Nicaragua (79.3%, a difference of 0.020%), Nicaraguan (79.3%, a difference of 0.020%), and Immigrants from Senegal (79.4%, a difference of 0.030%).
| Demographics | Rating | Rank | In Labor Force | Age 20-64 |
| Immigrants | Denmark | 26.9 /100 | #192 | Fair 79.4% |
| Indonesians | 26.1 /100 | #193 | Fair 79.4% |
| Immigrants | Thailand | 24.8 /100 | #194 | Fair 79.4% |
| Immigrants | Austria | 23.7 /100 | #195 | Fair 79.4% |
| Ecuadorians | 23.1 /100 | #196 | Fair 79.4% |
| Immigrants | Senegal | 22.5 /100 | #197 | Fair 79.4% |
| Immigrants | Laos | 21.5 /100 | #198 | Fair 79.4% |
| Dutch | 20.2 /100 | #199 | Fair 79.3% |
| Immigrants | Oceania | 19.1 /100 | #200 | Poor 79.3% |
| Immigrants | Nicaragua | 19.0 /100 | #201 | Poor 79.3% |
| Nicaraguans | 18.3 /100 | #202 | Poor 79.3% |
| Iraqis | 17.7 /100 | #203 | Poor 79.3% |
| Immigrants | Cambodia | 17.6 /100 | #204 | Poor 79.3% |
| Immigrants | Congo | 17.5 /100 | #205 | Poor 79.3% |
| Immigrants | Ecuador | 16.9 /100 | #206 | Poor 79.3% |