Immigrants from Hungary vs Macedonian In Labor Force | Age 16-19
COMPARE
Immigrants from Hungary
Macedonian
In Labor Force | Age 16-19
In Labor Force | Age 16-19 Comparison
Immigrants from Hungary
Macedonians
36.2%
IN LABOR FORCE | AGE 16-19
28.8/ 100
METRIC RATING
189th/ 347
METRIC RANK
37.8%
IN LABOR FORCE | AGE 16-19
93.4/ 100
METRIC RATING
135th/ 347
METRIC RANK
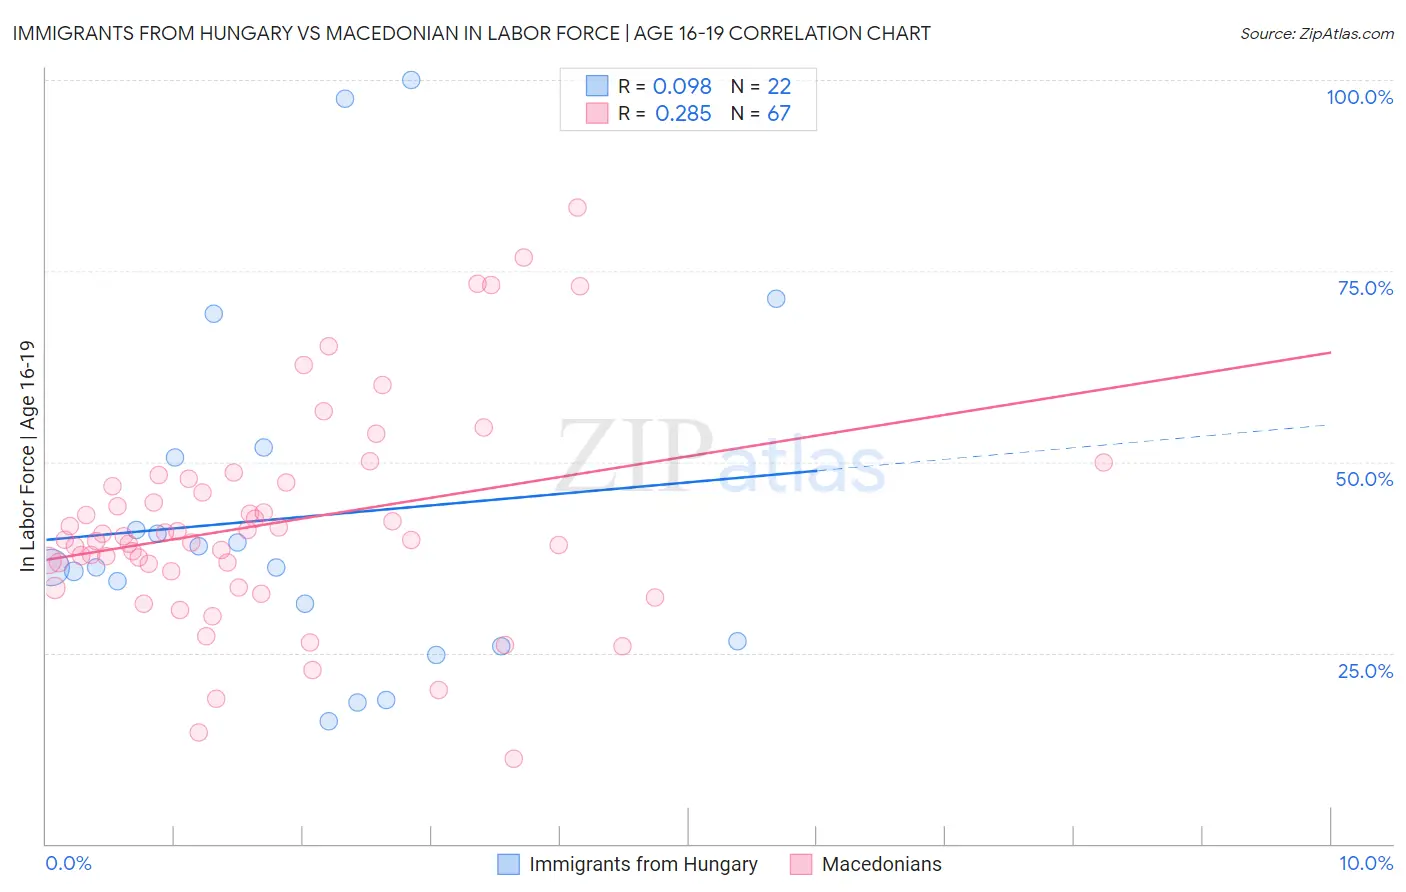
Immigrants from Hungary vs Macedonian In Labor Force | Age 16-19 Correlation Chart
The statistical analysis conducted on geographies consisting of 195,472,897 people shows a slight positive correlation between the proportion of Immigrants from Hungary and labor force participation rate among population between the ages 16 and 19 in the United States with a correlation coefficient (R) of 0.098 and weighted average of 36.2%. Similarly, the statistical analysis conducted on geographies consisting of 132,590,636 people shows a weak positive correlation between the proportion of Macedonians and labor force participation rate among population between the ages 16 and 19 in the United States with a correlation coefficient (R) of 0.285 and weighted average of 37.8%, a difference of 4.5%.
In Labor Force | Age 16-19 Correlation Summary
| Measurement | Immigrants from Hungary | Macedonian |
| Minimum | 16.1% | 11.2% |
| Maximum | 100.0% | 83.3% |
| Range | 83.9% | 72.1% |
| Mean | 42.8% | 41.9% |
| Median | 36.2% | 39.8% |
| Interquartile 25% (IQ1) | 26.5% | 35.7% |
| Interquartile 75% (IQ3) | 50.5% | 47.3% |
| Interquartile Range (IQR) | 24.0% | 11.5% |
| Standard Deviation (Sample) | 23.0% | 14.1% |
| Standard Deviation (Population) | 22.5% | 13.9% |
Similar Demographics by In Labor Force | Age 16-19
Demographics Similar to Immigrants from Hungary by In Labor Force | Age 16-19
In terms of in labor force | age 16-19, the demographic groups most similar to Immigrants from Hungary are Panamanian (36.1%, a difference of 0.010%), Immigrants from Croatia (36.1%, a difference of 0.080%), Immigrants from Europe (36.2%, a difference of 0.18%), Afghan (36.1%, a difference of 0.20%), and Immigrants from Denmark (36.1%, a difference of 0.25%).
| Demographics | Rating | Rank | In Labor Force | Age 16-19 |
| Immigrants | Italy | 39.1 /100 | #182 | Fair 36.4% |
| Eastern Europeans | 38.8 /100 | #183 | Fair 36.4% |
| Costa Ricans | 36.1 /100 | #184 | Fair 36.3% |
| Bhutanese | 35.3 /100 | #185 | Fair 36.3% |
| Immigrants | Romania | 34.0 /100 | #186 | Fair 36.3% |
| Immigrants | Afghanistan | 34.0 /100 | #187 | Fair 36.3% |
| Immigrants | Europe | 31.8 /100 | #188 | Fair 36.2% |
| Immigrants | Hungary | 28.8 /100 | #189 | Fair 36.2% |
| Panamanians | 28.6 /100 | #190 | Fair 36.1% |
| Immigrants | Croatia | 27.5 /100 | #191 | Fair 36.1% |
| Afghans | 25.7 /100 | #192 | Fair 36.1% |
| Immigrants | Denmark | 25.0 /100 | #193 | Fair 36.1% |
| Nigerians | 24.6 /100 | #194 | Fair 36.1% |
| Bolivians | 23.3 /100 | #195 | Fair 36.0% |
| Mexican American Indians | 21.1 /100 | #196 | Fair 36.0% |
Demographics Similar to Macedonians by In Labor Force | Age 16-19
In terms of in labor force | age 16-19, the demographic groups most similar to Macedonians are Australian (37.8%, a difference of 0.030%), Cajun (37.8%, a difference of 0.030%), Immigrants from Netherlands (37.8%, a difference of 0.060%), Comanche (37.7%, a difference of 0.26%), and Cheyenne (37.9%, a difference of 0.27%).
| Demographics | Rating | Rank | In Labor Force | Age 16-19 |
| New Zealanders | 95.6 /100 | #128 | Exceptional 38.0% |
| Spaniards | 95.5 /100 | #129 | Exceptional 38.0% |
| Immigrants | Zimbabwe | 95.4 /100 | #130 | Exceptional 38.0% |
| Immigrants | Austria | 95.0 /100 | #131 | Exceptional 37.9% |
| Immigrants | Oceania | 94.7 /100 | #132 | Exceptional 37.9% |
| Cheyenne | 94.6 /100 | #133 | Exceptional 37.9% |
| Immigrants | Netherlands | 93.7 /100 | #134 | Exceptional 37.8% |
| Macedonians | 93.4 /100 | #135 | Exceptional 37.8% |
| Australians | 93.2 /100 | #136 | Exceptional 37.8% |
| Cajuns | 93.2 /100 | #137 | Exceptional 37.8% |
| Comanche | 91.9 /100 | #138 | Exceptional 37.7% |
| Immigrants | Moldova | 91.9 /100 | #139 | Exceptional 37.7% |
| Estonians | 91.7 /100 | #140 | Exceptional 37.7% |
| Syrians | 90.7 /100 | #141 | Exceptional 37.6% |
| Sierra Leoneans | 89.7 /100 | #142 | Excellent 37.6% |