Hmong vs Bhutanese In Labor Force | Age > 16
COMPARE
Hmong
Bhutanese
In Labor Force | Age > 16
In Labor Force | Age > 16 Comparison
Hmong
Bhutanese
64.1%
IN LABOR FORCE | AGE > 16
0.3/ 100
METRIC RATING
273rd/ 347
METRIC RANK
65.5%
IN LABOR FORCE | AGE > 16
86.3/ 100
METRIC RATING
148th/ 347
METRIC RANK
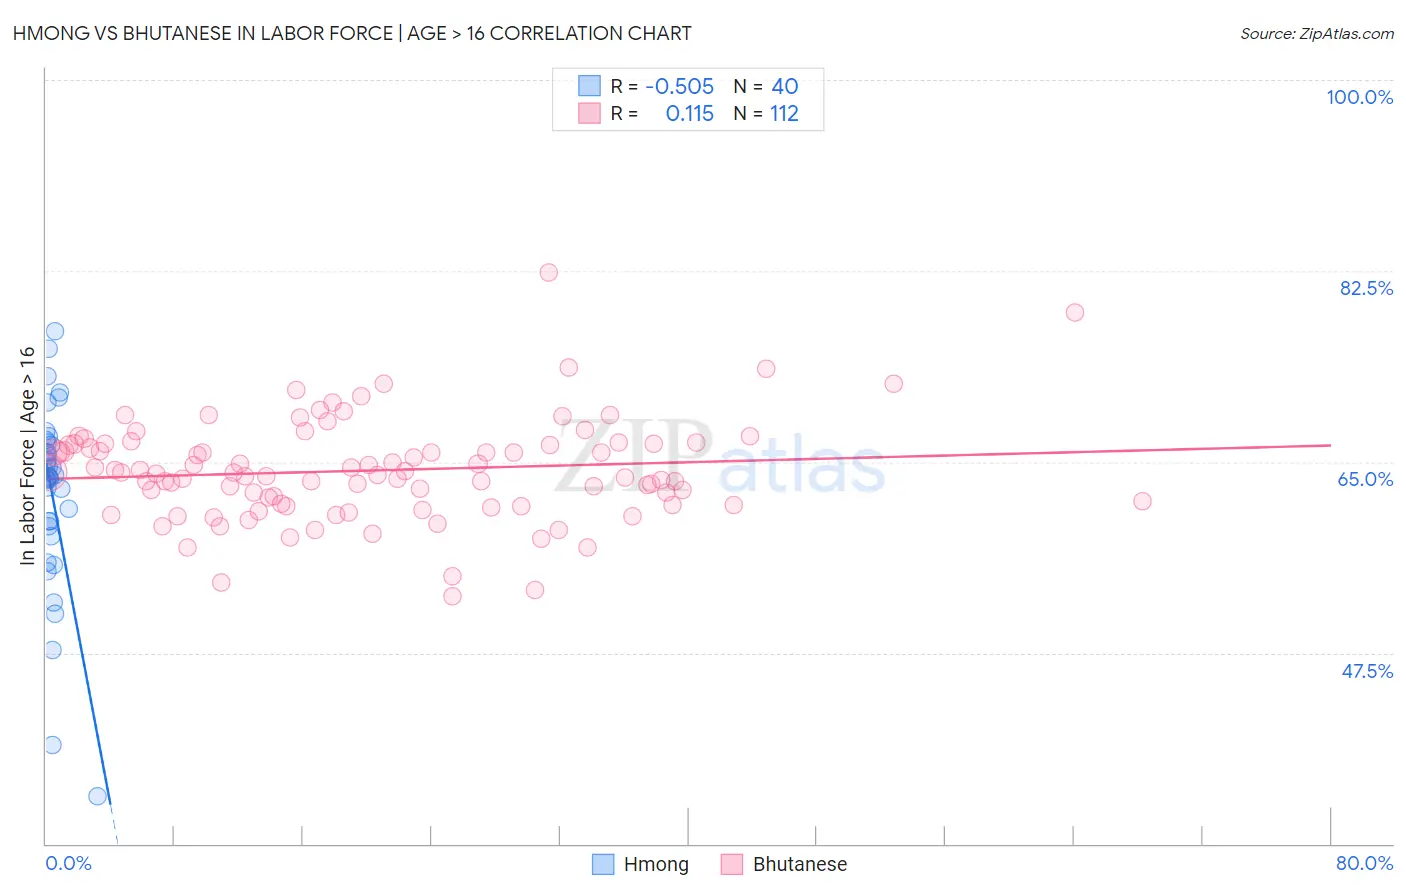
Hmong vs Bhutanese In Labor Force | Age > 16 Correlation Chart
The statistical analysis conducted on geographies consisting of 24,681,537 people shows a substantial negative correlation between the proportion of Hmong and labor force participation rate among population ages 16 and over in the United States with a correlation coefficient (R) of -0.505 and weighted average of 64.1%. Similarly, the statistical analysis conducted on geographies consisting of 455,605,488 people shows a poor positive correlation between the proportion of Bhutanese and labor force participation rate among population ages 16 and over in the United States with a correlation coefficient (R) of 0.115 and weighted average of 65.5%, a difference of 2.1%.
In Labor Force | Age > 16 Correlation Summary
| Measurement | Hmong | Bhutanese |
| Minimum | 34.3% | 52.7% |
| Maximum | 77.0% | 82.4% |
| Range | 42.7% | 29.7% |
| Mean | 62.2% | 64.2% |
| Median | 63.7% | 64.0% |
| Interquartile 25% (IQ1) | 59.3% | 61.1% |
| Interquartile 75% (IQ3) | 66.7% | 66.6% |
| Interquartile Range (IQR) | 7.3% | 5.6% |
| Standard Deviation (Sample) | 8.6% | 4.6% |
| Standard Deviation (Population) | 8.5% | 4.6% |
Similar Demographics by In Labor Force | Age > 16
Demographics Similar to Hmong by In Labor Force | Age > 16
In terms of in labor force | age > 16, the demographic groups most similar to Hmong are Native Hawaiian (64.1%, a difference of 0.0%), Immigrants from Cuba (64.1%, a difference of 0.020%), Mexican (64.1%, a difference of 0.020%), French American Indian (64.1%, a difference of 0.020%), and Guyanese (64.1%, a difference of 0.030%).
| Demographics | Rating | Rank | In Labor Force | Age > 16 |
| Immigrants | England | 0.5 /100 | #266 | Tragic 64.2% |
| Canadians | 0.5 /100 | #267 | Tragic 64.1% |
| Spaniards | 0.5 /100 | #268 | Tragic 64.1% |
| Irish | 0.4 /100 | #269 | Tragic 64.1% |
| Guyanese | 0.4 /100 | #270 | Tragic 64.1% |
| Dominicans | 0.4 /100 | #271 | Tragic 64.1% |
| Native Hawaiians | 0.3 /100 | #272 | Tragic 64.1% |
| Hmong | 0.3 /100 | #273 | Tragic 64.1% |
| Immigrants | Cuba | 0.3 /100 | #274 | Tragic 64.1% |
| Mexicans | 0.3 /100 | #275 | Tragic 64.1% |
| French American Indians | 0.3 /100 | #276 | Tragic 64.1% |
| Immigrants | Bahamas | 0.3 /100 | #277 | Tragic 64.0% |
| Assyrians/Chaldeans/Syriacs | 0.3 /100 | #278 | Tragic 64.0% |
| Welsh | 0.2 /100 | #279 | Tragic 64.0% |
| Immigrants | St. Vincent and the Grenadines | 0.2 /100 | #280 | Tragic 64.0% |
Demographics Similar to Bhutanese by In Labor Force | Age > 16
In terms of in labor force | age > 16, the demographic groups most similar to Bhutanese are Immigrants from Albania (65.4%, a difference of 0.010%), Immigrants from Oceania (65.5%, a difference of 0.030%), Tlingit-Haida (65.5%, a difference of 0.050%), Cypriot (65.5%, a difference of 0.050%), and Immigrants from Romania (65.5%, a difference of 0.060%).
| Demographics | Rating | Rank | In Labor Force | Age > 16 |
| Samoans | 90.5 /100 | #141 | Exceptional 65.5% |
| Indians (Asian) | 89.5 /100 | #142 | Excellent 65.5% |
| Latvians | 89.4 /100 | #143 | Excellent 65.5% |
| Immigrants | Romania | 88.6 /100 | #144 | Excellent 65.5% |
| Tlingit-Haida | 88.3 /100 | #145 | Excellent 65.5% |
| Cypriots | 88.2 /100 | #146 | Excellent 65.5% |
| Immigrants | Oceania | 87.5 /100 | #147 | Excellent 65.5% |
| Bhutanese | 86.3 /100 | #148 | Excellent 65.5% |
| Immigrants | Albania | 85.7 /100 | #149 | Excellent 65.4% |
| Immigrants | Immigrants | 81.9 /100 | #150 | Excellent 65.4% |
| Czechs | 81.5 /100 | #151 | Excellent 65.4% |
| Yugoslavians | 81.3 /100 | #152 | Excellent 65.4% |
| Immigrants | China | 80.5 /100 | #153 | Excellent 65.4% |
| Immigrants | Eastern Europe | 78.3 /100 | #154 | Good 65.4% |
| Immigrants | Armenia | 76.6 /100 | #155 | Good 65.3% |