Hmong vs Mongolian Female Poverty Among 18-24 Year Olds
COMPARE
Hmong
Mongolian
Female Poverty Among 18-24 Year Olds
Female Poverty Among 18-24 Year Olds Comparison
Hmong
Mongolians
20.0%
FEMALE POVERTY AMONG 18-24 YEAR OLDS
55.4/ 100
METRIC RATING
169th/ 347
METRIC RANK
21.6%
FEMALE POVERTY AMONG 18-24 YEAR OLDS
0.2/ 100
METRIC RATING
270th/ 347
METRIC RANK
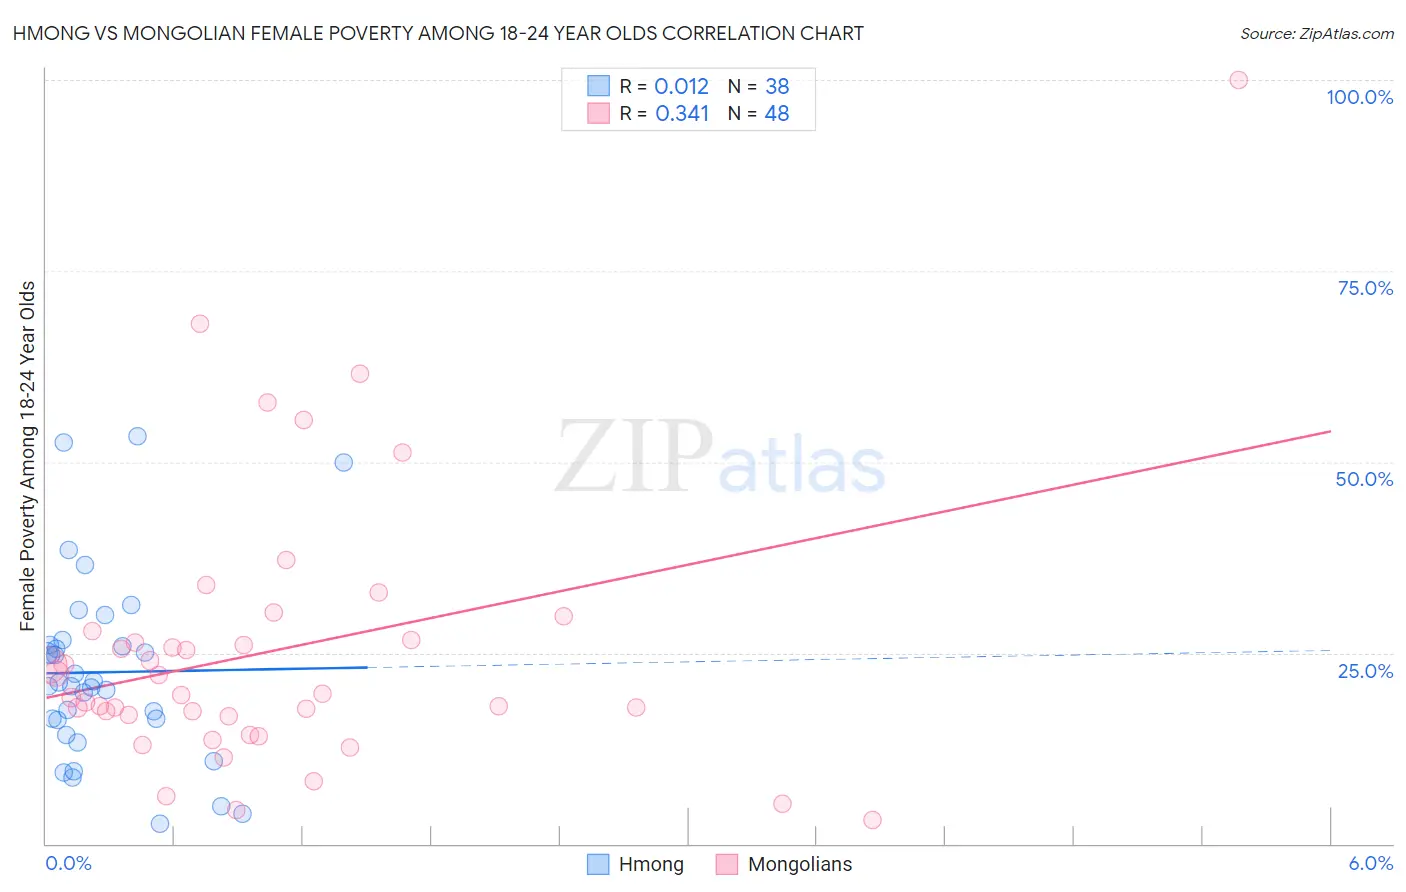
Hmong vs Mongolian Female Poverty Among 18-24 Year Olds Correlation Chart
The statistical analysis conducted on geographies consisting of 24,664,746 people shows no correlation between the proportion of Hmong and poverty level among females between the ages 18 and 24 in the United States with a correlation coefficient (R) of 0.012 and weighted average of 20.0%. Similarly, the statistical analysis conducted on geographies consisting of 139,425,379 people shows a mild positive correlation between the proportion of Mongolians and poverty level among females between the ages 18 and 24 in the United States with a correlation coefficient (R) of 0.341 and weighted average of 21.6%, a difference of 7.7%.
Female Poverty Among 18-24 Year Olds Correlation Summary
| Measurement | Hmong | Mongolian |
| Minimum | 2.6% | 3.0% |
| Maximum | 53.3% | 100.0% |
| Range | 50.7% | 97.0% |
| Mean | 22.5% | 25.3% |
| Median | 20.9% | 19.6% |
| Interquartile 25% (IQ1) | 16.2% | 16.8% |
| Interquartile 75% (IQ3) | 26.1% | 27.2% |
| Interquartile Range (IQR) | 9.9% | 10.5% |
| Standard Deviation (Sample) | 12.1% | 18.1% |
| Standard Deviation (Population) | 11.9% | 17.9% |
Similar Demographics by Female Poverty Among 18-24 Year Olds
Demographics Similar to Hmong by Female Poverty Among 18-24 Year Olds
In terms of female poverty among 18-24 year olds, the demographic groups most similar to Hmong are Iranian (20.1%, a difference of 0.040%), Immigrants from Nigeria (20.1%, a difference of 0.060%), Belizean (20.1%, a difference of 0.17%), Fijian (20.0%, a difference of 0.19%), and Irish (20.1%, a difference of 0.27%).
| Demographics | Rating | Rank | Female Poverty Among 18-24 Year Olds |
| French Canadians | 73.0 /100 | #162 | Good 19.9% |
| Malaysians | 72.7 /100 | #163 | Good 19.9% |
| Central Americans | 70.0 /100 | #164 | Good 19.9% |
| Eastern Europeans | 69.3 /100 | #165 | Good 19.9% |
| Belgians | 69.1 /100 | #166 | Good 19.9% |
| Czechoslovakians | 61.8 /100 | #167 | Good 20.0% |
| Fijians | 59.1 /100 | #168 | Average 20.0% |
| Hmong | 55.4 /100 | #169 | Average 20.0% |
| Iranians | 54.7 /100 | #170 | Average 20.1% |
| Immigrants | Nigeria | 54.3 /100 | #171 | Average 20.1% |
| Belizeans | 52.0 /100 | #172 | Average 20.1% |
| Irish | 50.0 /100 | #173 | Average 20.1% |
| Swedes | 50.0 /100 | #174 | Average 20.1% |
| South American Indians | 48.4 /100 | #175 | Average 20.1% |
| Kenyans | 44.9 /100 | #176 | Average 20.2% |
Demographics Similar to Mongolians by Female Poverty Among 18-24 Year Olds
In terms of female poverty among 18-24 year olds, the demographic groups most similar to Mongolians are Scotch-Irish (21.6%, a difference of 0.010%), Celtic (21.6%, a difference of 0.030%), Immigrants from Burma/Myanmar (21.6%, a difference of 0.090%), American (21.6%, a difference of 0.23%), and Basque (21.7%, a difference of 0.29%).
| Demographics | Rating | Rank | Female Poverty Among 18-24 Year Olds |
| Icelanders | 0.3 /100 | #263 | Tragic 21.5% |
| Hondurans | 0.3 /100 | #264 | Tragic 21.5% |
| Immigrants | Nonimmigrants | 0.3 /100 | #265 | Tragic 21.5% |
| Alaska Natives | 0.3 /100 | #266 | Tragic 21.5% |
| Americans | 0.3 /100 | #267 | Tragic 21.6% |
| Immigrants | Burma/Myanmar | 0.2 /100 | #268 | Tragic 21.6% |
| Celtics | 0.2 /100 | #269 | Tragic 21.6% |
| Mongolians | 0.2 /100 | #270 | Tragic 21.6% |
| Scotch-Irish | 0.2 /100 | #271 | Tragic 21.6% |
| Basques | 0.2 /100 | #272 | Tragic 21.7% |
| New Zealanders | 0.2 /100 | #273 | Tragic 21.7% |
| Immigrants | Honduras | 0.1 /100 | #274 | Tragic 21.8% |
| Immigrants | Bangladesh | 0.1 /100 | #275 | Tragic 21.8% |
| Bahamians | 0.1 /100 | #276 | Tragic 21.8% |
| Immigrants | Switzerland | 0.1 /100 | #277 | Tragic 21.8% |