Hmong vs Albanian In Labor Force | Age > 16
COMPARE
Hmong
Albanian
In Labor Force | Age > 16
In Labor Force | Age > 16 Comparison
Hmong
Albanians
64.1%
IN LABOR FORCE | AGE > 16
0.3/ 100
METRIC RATING
273rd/ 347
METRIC RANK
65.3%
IN LABOR FORCE | AGE > 16
70.8/ 100
METRIC RATING
162nd/ 347
METRIC RANK
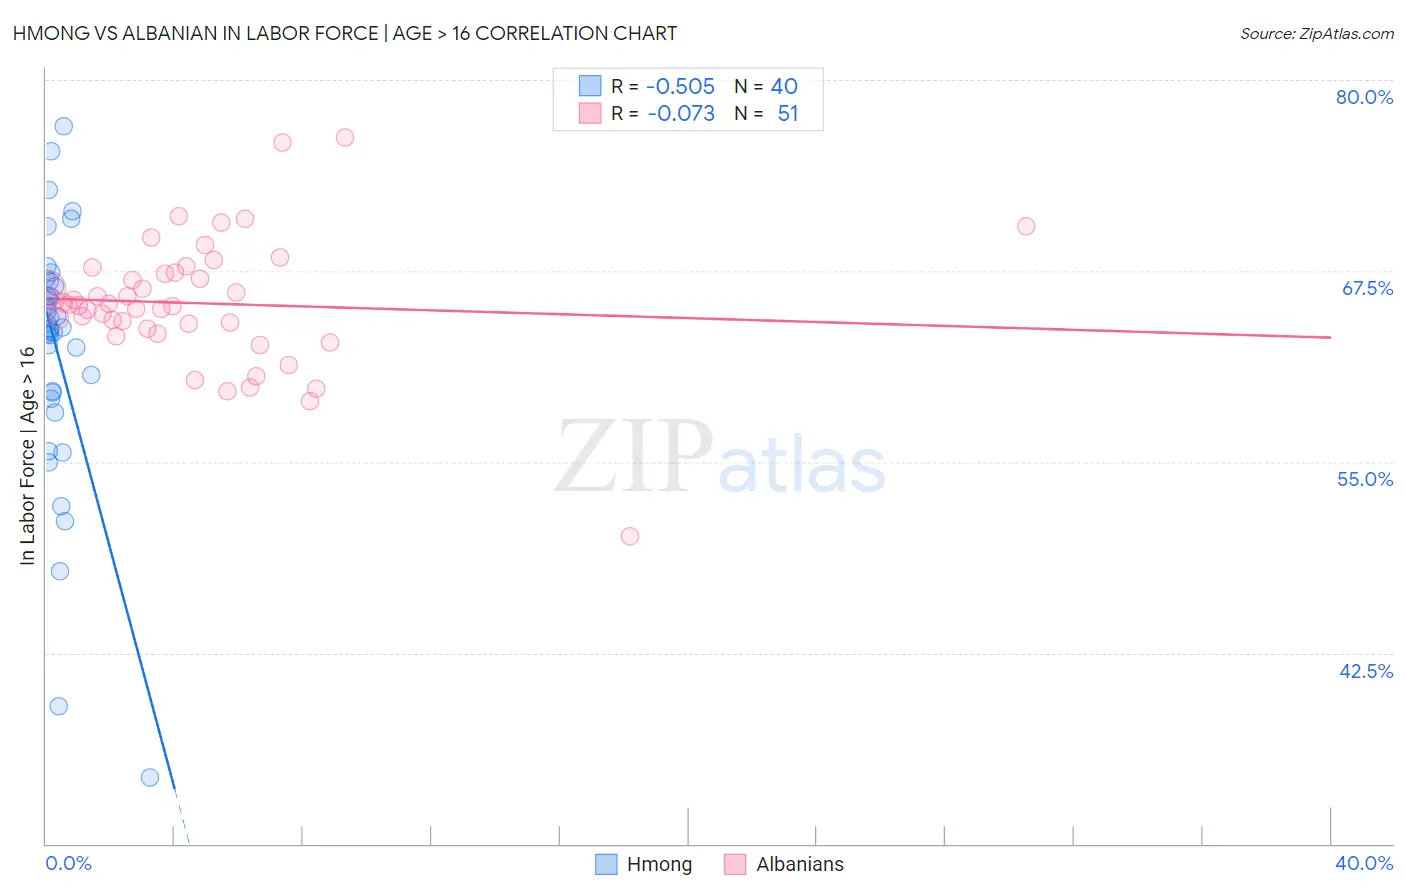
Hmong vs Albanian In Labor Force | Age > 16 Correlation Chart
The statistical analysis conducted on geographies consisting of 24,681,537 people shows a substantial negative correlation between the proportion of Hmong and labor force participation rate among population ages 16 and over in the United States with a correlation coefficient (R) of -0.505 and weighted average of 64.1%. Similarly, the statistical analysis conducted on geographies consisting of 193,265,279 people shows a slight negative correlation between the proportion of Albanians and labor force participation rate among population ages 16 and over in the United States with a correlation coefficient (R) of -0.073 and weighted average of 65.3%, a difference of 1.9%.
In Labor Force | Age > 16 Correlation Summary
| Measurement | Hmong | Albanian |
| Minimum | 34.3% | 50.1% |
| Maximum | 77.0% | 76.2% |
| Range | 42.7% | 26.1% |
| Mean | 62.2% | 65.4% |
| Median | 63.7% | 65.3% |
| Interquartile 25% (IQ1) | 59.3% | 63.7% |
| Interquartile 75% (IQ3) | 66.7% | 67.4% |
| Interquartile Range (IQR) | 7.3% | 3.7% |
| Standard Deviation (Sample) | 8.6% | 4.2% |
| Standard Deviation (Population) | 8.5% | 4.2% |
Similar Demographics by In Labor Force | Age > 16
Demographics Similar to Hmong by In Labor Force | Age > 16
In terms of in labor force | age > 16, the demographic groups most similar to Hmong are Native Hawaiian (64.1%, a difference of 0.0%), Immigrants from Cuba (64.1%, a difference of 0.020%), Mexican (64.1%, a difference of 0.020%), French American Indian (64.1%, a difference of 0.020%), and Guyanese (64.1%, a difference of 0.030%).
| Demographics | Rating | Rank | In Labor Force | Age > 16 |
| Immigrants | England | 0.5 /100 | #266 | Tragic 64.2% |
| Canadians | 0.5 /100 | #267 | Tragic 64.1% |
| Spaniards | 0.5 /100 | #268 | Tragic 64.1% |
| Irish | 0.4 /100 | #269 | Tragic 64.1% |
| Guyanese | 0.4 /100 | #270 | Tragic 64.1% |
| Dominicans | 0.4 /100 | #271 | Tragic 64.1% |
| Native Hawaiians | 0.3 /100 | #272 | Tragic 64.1% |
| Hmong | 0.3 /100 | #273 | Tragic 64.1% |
| Immigrants | Cuba | 0.3 /100 | #274 | Tragic 64.1% |
| Mexicans | 0.3 /100 | #275 | Tragic 64.1% |
| French American Indians | 0.3 /100 | #276 | Tragic 64.1% |
| Immigrants | Bahamas | 0.3 /100 | #277 | Tragic 64.0% |
| Assyrians/Chaldeans/Syriacs | 0.3 /100 | #278 | Tragic 64.0% |
| Welsh | 0.2 /100 | #279 | Tragic 64.0% |
| Immigrants | St. Vincent and the Grenadines | 0.2 /100 | #280 | Tragic 64.0% |
Demographics Similar to Albanians by In Labor Force | Age > 16
In terms of in labor force | age > 16, the demographic groups most similar to Albanians are Australian (65.3%, a difference of 0.010%), South African (65.3%, a difference of 0.010%), Danish (65.3%, a difference of 0.030%), Immigrants from South Africa (65.3%, a difference of 0.040%), and Immigrants from Kazakhstan (65.3%, a difference of 0.040%).
| Demographics | Rating | Rank | In Labor Force | Age > 16 |
| Immigrants | Armenia | 76.6 /100 | #155 | Good 65.3% |
| Immigrants | Ireland | 75.9 /100 | #156 | Good 65.3% |
| Immigrants | Russia | 75.7 /100 | #157 | Good 65.3% |
| Panamanians | 75.2 /100 | #158 | Good 65.3% |
| Immigrants | Syria | 74.6 /100 | #159 | Good 65.3% |
| Immigrants | South Africa | 73.5 /100 | #160 | Good 65.3% |
| Australians | 71.3 /100 | #161 | Good 65.3% |
| Albanians | 70.8 /100 | #162 | Good 65.3% |
| South Africans | 69.8 /100 | #163 | Good 65.3% |
| Danes | 68.8 /100 | #164 | Good 65.3% |
| Immigrants | Kazakhstan | 68.1 /100 | #165 | Good 65.3% |
| Immigrants | Western Asia | 67.3 /100 | #166 | Good 65.3% |
| Immigrants | Belarus | 66.0 /100 | #167 | Good 65.2% |
| Serbians | 63.5 /100 | #168 | Good 65.2% |
| Arabs | 62.4 /100 | #169 | Good 65.2% |