Immigrants from Morocco vs Lumbee In Labor Force | Age 16-19
COMPARE
Immigrants from Morocco
Lumbee
In Labor Force | Age 16-19
In Labor Force | Age 16-19 Comparison
Immigrants from Morocco
Lumbee
36.4%
IN LABOR FORCE | AGE 16-19
41.1/ 100
METRIC RATING
180th/ 347
METRIC RANK
31.0%
IN LABOR FORCE | AGE 16-19
0.0/ 100
METRIC RATING
330th/ 347
METRIC RANK
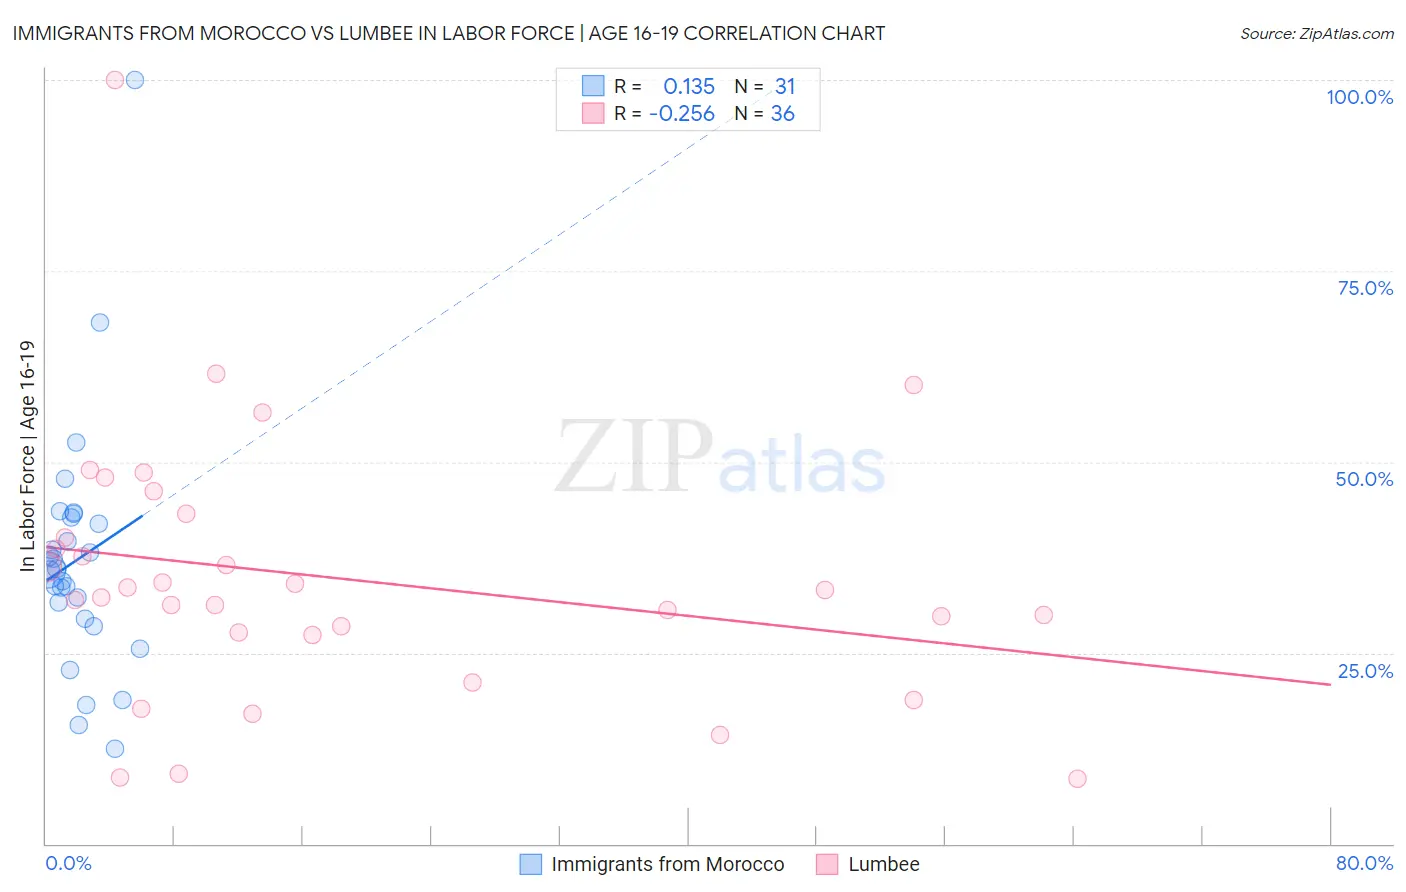
Immigrants from Morocco vs Lumbee In Labor Force | Age 16-19 Correlation Chart
The statistical analysis conducted on geographies consisting of 178,800,996 people shows a poor positive correlation between the proportion of Immigrants from Morocco and labor force participation rate among population between the ages 16 and 19 in the United States with a correlation coefficient (R) of 0.135 and weighted average of 36.4%. Similarly, the statistical analysis conducted on geographies consisting of 92,241,195 people shows a weak negative correlation between the proportion of Lumbee and labor force participation rate among population between the ages 16 and 19 in the United States with a correlation coefficient (R) of -0.256 and weighted average of 31.0%, a difference of 17.5%.
In Labor Force | Age 16-19 Correlation Summary
| Measurement | Immigrants from Morocco | Lumbee |
| Minimum | 12.5% | 8.5% |
| Maximum | 100.0% | 100.0% |
| Range | 87.5% | 91.5% |
| Mean | 37.2% | 34.8% |
| Median | 35.9% | 32.7% |
| Interquartile 25% (IQ1) | 29.4% | 27.5% |
| Interquartile 75% (IQ3) | 42.6% | 41.7% |
| Interquartile Range (IQR) | 13.2% | 14.2% |
| Standard Deviation (Sample) | 16.1% | 17.4% |
| Standard Deviation (Population) | 15.9% | 17.2% |
Similar Demographics by In Labor Force | Age 16-19
Demographics Similar to Immigrants from Morocco by In Labor Force | Age 16-19
In terms of in labor force | age 16-19, the demographic groups most similar to Immigrants from Morocco are Jordanian (36.4%, a difference of 0.080%), Immigrants from Italy (36.4%, a difference of 0.10%), Immigrants from Southern Europe (36.4%, a difference of 0.12%), Eastern European (36.4%, a difference of 0.12%), and Black/African American (36.5%, a difference of 0.21%).
| Demographics | Rating | Rank | In Labor Force | Age 16-19 |
| Russians | 57.5 /100 | #173 | Average 36.7% |
| Immigrants | Czechoslovakia | 50.0 /100 | #174 | Average 36.6% |
| Natives/Alaskans | 49.0 /100 | #175 | Average 36.6% |
| Albanians | 48.8 /100 | #176 | Average 36.5% |
| Immigrants | Northern Europe | 46.6 /100 | #177 | Average 36.5% |
| Blacks/African Americans | 45.1 /100 | #178 | Average 36.5% |
| Immigrants | Southern Europe | 43.3 /100 | #179 | Average 36.4% |
| Immigrants | Morocco | 41.1 /100 | #180 | Average 36.4% |
| Jordanians | 39.6 /100 | #181 | Fair 36.4% |
| Immigrants | Italy | 39.1 /100 | #182 | Fair 36.4% |
| Eastern Europeans | 38.8 /100 | #183 | Fair 36.4% |
| Costa Ricans | 36.1 /100 | #184 | Fair 36.3% |
| Bhutanese | 35.3 /100 | #185 | Fair 36.3% |
| Immigrants | Romania | 34.0 /100 | #186 | Fair 36.3% |
| Immigrants | Afghanistan | 34.0 /100 | #187 | Fair 36.3% |
Demographics Similar to Lumbee by In Labor Force | Age 16-19
In terms of in labor force | age 16-19, the demographic groups most similar to Lumbee are Barbadian (31.0%, a difference of 0.12%), Immigrants from Ecuador (31.0%, a difference of 0.15%), Trinidadian and Tobagonian (30.9%, a difference of 0.15%), Immigrants from Taiwan (31.0%, a difference of 0.19%), and Immigrants from Dominican Republic (31.1%, a difference of 0.35%).
| Demographics | Rating | Rank | In Labor Force | Age 16-19 |
| Immigrants | Caribbean | 0.0 /100 | #323 | Tragic 31.2% |
| Dominicans | 0.0 /100 | #324 | Tragic 31.2% |
| Immigrants | China | 0.0 /100 | #325 | Tragic 31.1% |
| Immigrants | Dominican Republic | 0.0 /100 | #326 | Tragic 31.1% |
| Immigrants | Taiwan | 0.0 /100 | #327 | Tragic 31.0% |
| Immigrants | Ecuador | 0.0 /100 | #328 | Tragic 31.0% |
| Barbadians | 0.0 /100 | #329 | Tragic 31.0% |
| Lumbee | 0.0 /100 | #330 | Tragic 31.0% |
| Trinidadians and Tobagonians | 0.0 /100 | #331 | Tragic 30.9% |
| Immigrants | Israel | 0.0 /100 | #332 | Tragic 30.5% |
| Immigrants | Hong Kong | 0.0 /100 | #333 | Tragic 30.5% |
| Puerto Ricans | 0.0 /100 | #334 | Tragic 30.3% |
| Immigrants | Cuba | 0.0 /100 | #335 | Tragic 30.2% |
| Immigrants | Trinidad and Tobago | 0.0 /100 | #336 | Tragic 30.2% |
| Immigrants | Bangladesh | 0.0 /100 | #337 | Tragic 30.0% |