Hmong vs Native Hawaiian In Labor Force | Age 30-34
COMPARE
Hmong
Native Hawaiian
In Labor Force | Age 30-34
In Labor Force | Age 30-34 Comparison
Hmong
Native Hawaiians
82.4%
IN LABOR FORCE | AGE 30-34
0.0/ 100
METRIC RATING
300th/ 347
METRIC RANK
83.0%
IN LABOR FORCE | AGE 30-34
0.0/ 100
METRIC RATING
287th/ 347
METRIC RANK
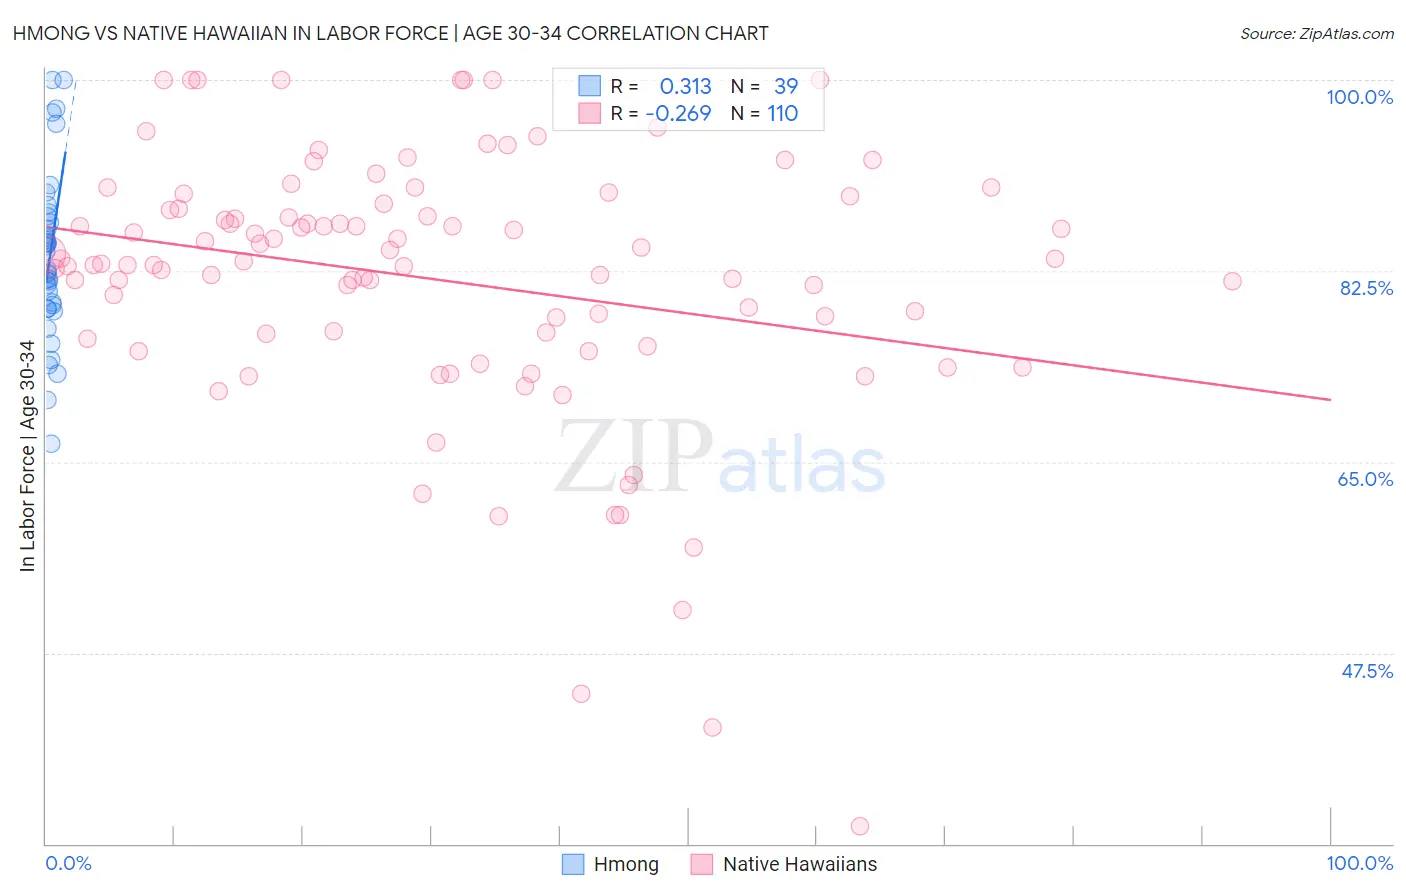
Hmong vs Native Hawaiian In Labor Force | Age 30-34 Correlation Chart
The statistical analysis conducted on geographies consisting of 24,678,157 people shows a mild positive correlation between the proportion of Hmong and labor force participation rate among population between the ages 30 and 34 in the United States with a correlation coefficient (R) of 0.313 and weighted average of 82.4%. Similarly, the statistical analysis conducted on geographies consisting of 331,941,727 people shows a weak negative correlation between the proportion of Native Hawaiians and labor force participation rate among population between the ages 30 and 34 in the United States with a correlation coefficient (R) of -0.269 and weighted average of 83.0%, a difference of 0.75%.
In Labor Force | Age 30-34 Correlation Summary
| Measurement | Hmong | Native Hawaiian |
| Minimum | 66.7% | 31.6% |
| Maximum | 100.0% | 100.0% |
| Range | 33.3% | 68.4% |
| Mean | 83.7% | 81.7% |
| Median | 82.6% | 83.3% |
| Interquartile 25% (IQ1) | 79.1% | 76.7% |
| Interquartile 75% (IQ3) | 87.5% | 88.2% |
| Interquartile Range (IQR) | 8.4% | 11.5% |
| Standard Deviation (Sample) | 7.6% | 12.3% |
| Standard Deviation (Population) | 7.5% | 12.2% |
Demographics Similar to Hmong and Native Hawaiians by In Labor Force | Age 30-34
In terms of in labor force | age 30-34, the demographic groups most similar to Hmong are Hispanic or Latino (82.4%, a difference of 0.010%), Ottawa (82.4%, a difference of 0.040%), Immigrants from Micronesia (82.4%, a difference of 0.050%), Immigrants from Central America (82.5%, a difference of 0.060%), and Aleut (82.6%, a difference of 0.18%). Similarly, the demographic groups most similar to Native Hawaiians are Central American Indian (83.0%, a difference of 0.030%), Hawaiian (83.0%, a difference of 0.050%), Immigrants from Latin America (83.1%, a difference of 0.10%), Immigrants from Belize (83.2%, a difference of 0.16%), and Cree (83.2%, a difference of 0.16%).
| Demographics | Rating | Rank | In Labor Force | Age 30-34 |
| Assyrians/Chaldeans/Syriacs | 0.0 /100 | #283 | Tragic 83.2% |
| Immigrants | Belize | 0.0 /100 | #284 | Tragic 83.2% |
| Cree | 0.0 /100 | #285 | Tragic 83.2% |
| Immigrants | Latin America | 0.0 /100 | #286 | Tragic 83.1% |
| Native Hawaiians | 0.0 /100 | #287 | Tragic 83.0% |
| Central American Indians | 0.0 /100 | #288 | Tragic 83.0% |
| Hawaiians | 0.0 /100 | #289 | Tragic 83.0% |
| Blackfeet | 0.0 /100 | #290 | Tragic 82.8% |
| Potawatomi | 0.0 /100 | #291 | Tragic 82.8% |
| Blacks/African Americans | 0.0 /100 | #292 | Tragic 82.8% |
| Nepalese | 0.0 /100 | #293 | Tragic 82.7% |
| Americans | 0.0 /100 | #294 | Tragic 82.7% |
| Pennsylvania Germans | 0.0 /100 | #295 | Tragic 82.6% |
| Chippewa | 0.0 /100 | #296 | Tragic 82.6% |
| Comanche | 0.0 /100 | #297 | Tragic 82.6% |
| Aleuts | 0.0 /100 | #298 | Tragic 82.6% |
| Immigrants | Central America | 0.0 /100 | #299 | Tragic 82.5% |
| Hmong | 0.0 /100 | #300 | Tragic 82.4% |
| Hispanics or Latinos | 0.0 /100 | #301 | Tragic 82.4% |
| Ottawa | 0.0 /100 | #302 | Tragic 82.4% |
| Immigrants | Micronesia | 0.0 /100 | #303 | Tragic 82.4% |