Immigrants from Argentina vs Immigrants from Hungary In Labor Force | Age 25-29
COMPARE
Immigrants from Argentina
Immigrants from Hungary
In Labor Force | Age 25-29
In Labor Force | Age 25-29 Comparison
Immigrants from Argentina
Immigrants from Hungary
84.6%
IN LABOR FORCE | AGE 25-29
44.0/ 100
METRIC RATING
179th/ 347
METRIC RANK
84.8%
IN LABOR FORCE | AGE 25-29
76.4/ 100
METRIC RATING
135th/ 347
METRIC RANK
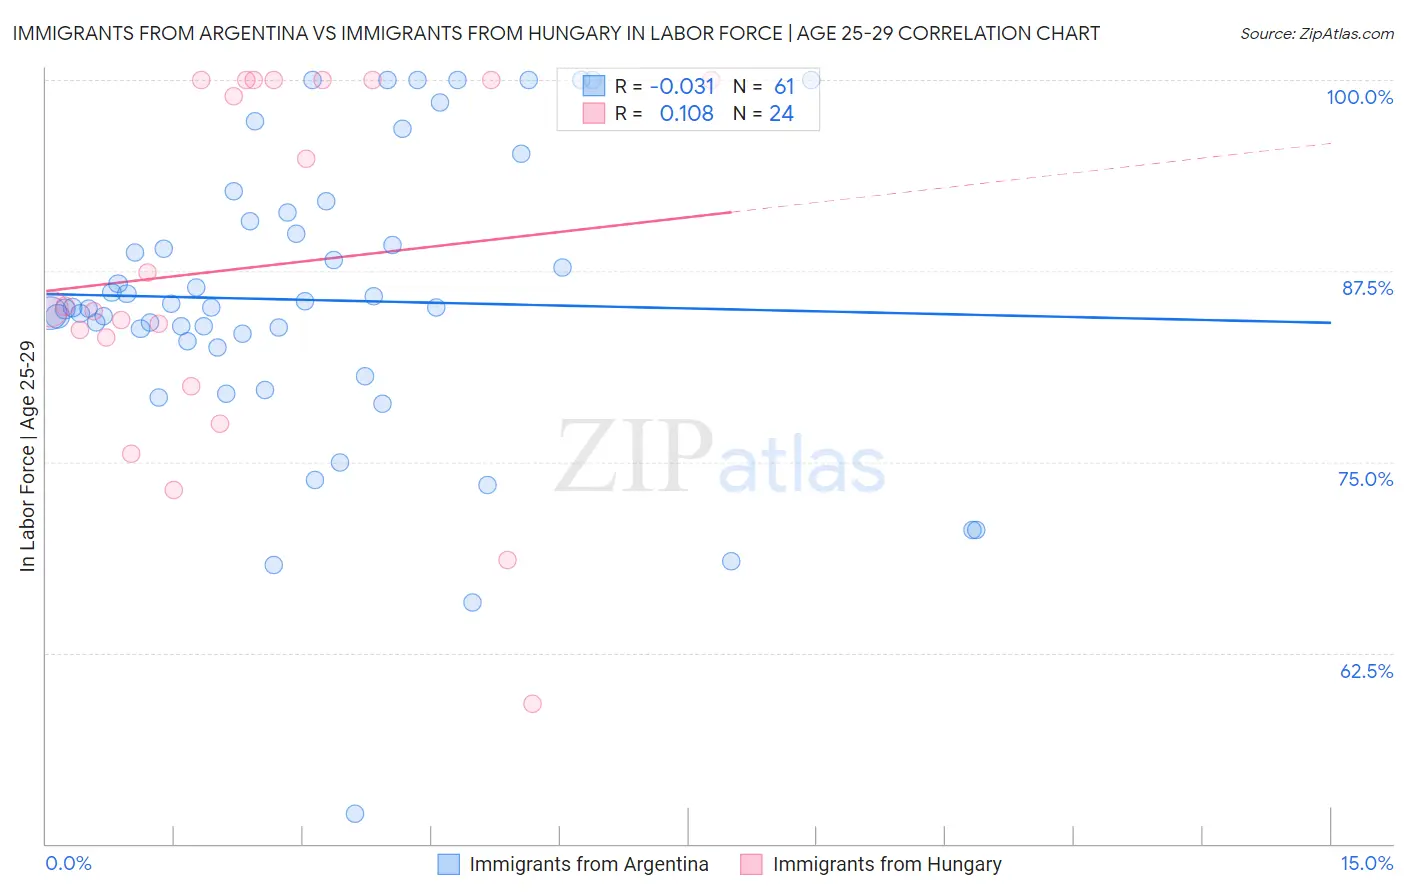
Immigrants from Argentina vs Immigrants from Hungary In Labor Force | Age 25-29 Correlation Chart
The statistical analysis conducted on geographies consisting of 264,395,747 people shows no correlation between the proportion of Immigrants from Argentina and labor force participation rate among population between the ages 25 and 29 in the United States with a correlation coefficient (R) of -0.031 and weighted average of 84.6%. Similarly, the statistical analysis conducted on geographies consisting of 195,638,068 people shows a poor positive correlation between the proportion of Immigrants from Hungary and labor force participation rate among population between the ages 25 and 29 in the United States with a correlation coefficient (R) of 0.108 and weighted average of 84.8%, a difference of 0.26%.
In Labor Force | Age 25-29 Correlation Summary
| Measurement | Immigrants from Argentina | Immigrants from Hungary |
| Minimum | 52.0% | 59.2% |
| Maximum | 100.0% | 100.0% |
| Range | 48.0% | 40.8% |
| Mean | 85.6% | 87.7% |
| Median | 85.1% | 85.1% |
| Interquartile 25% (IQ1) | 82.7% | 81.6% |
| Interquartile 75% (IQ3) | 91.1% | 100.0% |
| Interquartile Range (IQR) | 8.4% | 18.4% |
| Standard Deviation (Sample) | 9.7% | 11.7% |
| Standard Deviation (Population) | 9.6% | 11.5% |
Similar Demographics by In Labor Force | Age 25-29
Demographics Similar to Immigrants from Argentina by In Labor Force | Age 25-29
In terms of in labor force | age 25-29, the demographic groups most similar to Immigrants from Argentina are Immigrants from China (84.6%, a difference of 0.010%), Immigrants from Thailand (84.6%, a difference of 0.010%), Immigrants from South America (84.6%, a difference of 0.010%), Malaysian (84.6%, a difference of 0.020%), and Immigrants from Norway (84.6%, a difference of 0.020%).
| Demographics | Rating | Rank | In Labor Force | Age 25-29 |
| Immigrants | Western Europe | 50.4 /100 | #172 | Average 84.7% |
| Assyrians/Chaldeans/Syriacs | 50.2 /100 | #173 | Average 84.7% |
| Palestinians | 50.0 /100 | #174 | Average 84.7% |
| Hungarians | 47.8 /100 | #175 | Average 84.6% |
| Malaysians | 46.8 /100 | #176 | Average 84.6% |
| Immigrants | China | 45.7 /100 | #177 | Average 84.6% |
| Immigrants | Thailand | 45.2 /100 | #178 | Average 84.6% |
| Immigrants | Argentina | 44.0 /100 | #179 | Average 84.6% |
| Immigrants | South America | 42.9 /100 | #180 | Average 84.6% |
| Immigrants | Norway | 41.9 /100 | #181 | Average 84.6% |
| Europeans | 40.3 /100 | #182 | Average 84.6% |
| Scottish | 40.1 /100 | #183 | Average 84.6% |
| Immigrants | Kuwait | 38.2 /100 | #184 | Fair 84.6% |
| Immigrants | Denmark | 37.0 /100 | #185 | Fair 84.6% |
| Immigrants | Belgium | 35.0 /100 | #186 | Fair 84.6% |
Demographics Similar to Immigrants from Hungary by In Labor Force | Age 25-29
In terms of in labor force | age 25-29, the demographic groups most similar to Immigrants from Hungary are Syrian (84.8%, a difference of 0.0%), Bhutanese (84.8%, a difference of 0.0%), Romanian (84.8%, a difference of 0.010%), Asian (84.8%, a difference of 0.010%), and Iranian (84.8%, a difference of 0.020%).
| Demographics | Rating | Rank | In Labor Force | Age 25-29 |
| Australians | 83.6 /100 | #128 | Excellent 84.9% |
| Immigrants | Russia | 81.6 /100 | #129 | Excellent 84.9% |
| Northern Europeans | 81.3 /100 | #130 | Excellent 84.9% |
| Iranians | 78.1 /100 | #131 | Good 84.8% |
| Romanians | 77.7 /100 | #132 | Good 84.8% |
| Asians | 77.7 /100 | #133 | Good 84.8% |
| Syrians | 76.5 /100 | #134 | Good 84.8% |
| Immigrants | Hungary | 76.4 /100 | #135 | Good 84.8% |
| Bhutanese | 76.0 /100 | #136 | Good 84.8% |
| Immigrants | Canada | 73.5 /100 | #137 | Good 84.8% |
| Armenians | 72.7 /100 | #138 | Good 84.8% |
| Immigrants | Eastern Asia | 72.6 /100 | #139 | Good 84.8% |
| Immigrants | North America | 72.1 /100 | #140 | Good 84.8% |
| Danes | 71.9 /100 | #141 | Good 84.8% |
| Pakistanis | 70.0 /100 | #142 | Good 84.8% |