Immigrants vs Japanese In Labor Force | Age 16-19
COMPARE
Immigrants
Japanese
In Labor Force | Age 16-19
In Labor Force | Age 16-19 Comparison
Immigrants
Japanese
34.6%
IN LABOR FORCE | AGE 16-19
1.2/ 100
METRIC RATING
259th/ 347
METRIC RANK
37.5%
IN LABOR FORCE | AGE 16-19
89.3/ 100
METRIC RATING
144th/ 347
METRIC RANK
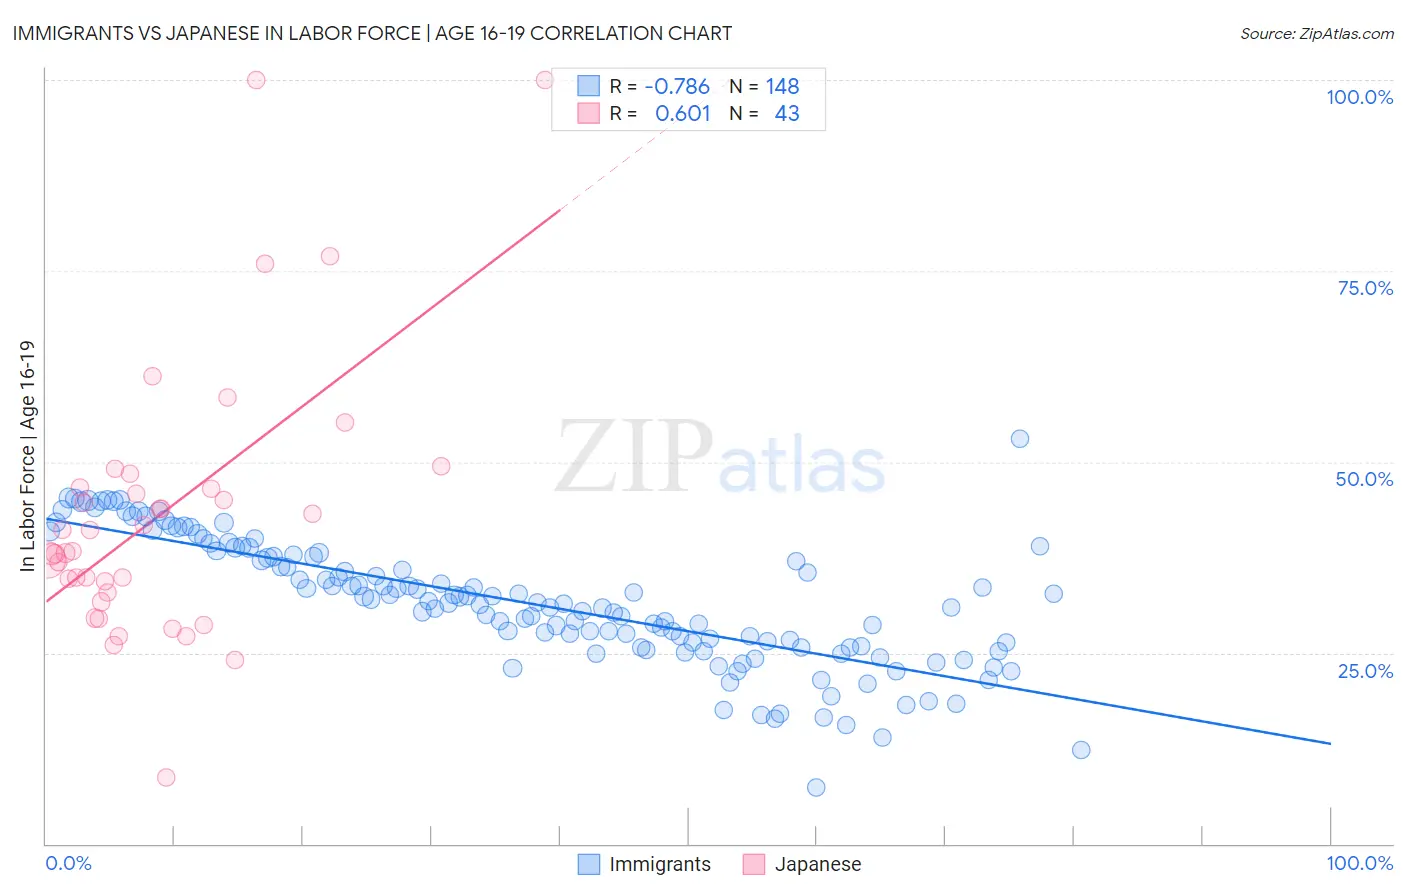
Immigrants vs Japanese In Labor Force | Age 16-19 Correlation Chart
The statistical analysis conducted on geographies consisting of 573,117,494 people shows a strong negative correlation between the proportion of Immigrants and labor force participation rate among population between the ages 16 and 19 in the United States with a correlation coefficient (R) of -0.786 and weighted average of 34.6%. Similarly, the statistical analysis conducted on geographies consisting of 249,091,187 people shows a significant positive correlation between the proportion of Japanese and labor force participation rate among population between the ages 16 and 19 in the United States with a correlation coefficient (R) of 0.601 and weighted average of 37.5%, a difference of 8.7%.
In Labor Force | Age 16-19 Correlation Summary
| Measurement | Immigrants | Japanese |
| Minimum | 7.3% | 8.6% |
| Maximum | 53.1% | 100.0% |
| Range | 45.8% | 91.4% |
| Mean | 31.5% | 43.1% |
| Median | 31.6% | 38.2% |
| Interquartile 25% (IQ1) | 25.8% | 32.8% |
| Interquartile 75% (IQ3) | 37.7% | 46.7% |
| Interquartile Range (IQR) | 12.0% | 13.8% |
| Standard Deviation (Sample) | 8.3% | 17.9% |
| Standard Deviation (Population) | 8.2% | 17.7% |
Similar Demographics by In Labor Force | Age 16-19
Demographics Similar to Immigrants by In Labor Force | Age 16-19
In terms of in labor force | age 16-19, the demographic groups most similar to Immigrants are Immigrants from Egypt (34.6%, a difference of 0.020%), Thai (34.6%, a difference of 0.020%), Immigrants from South Central Asia (34.6%, a difference of 0.030%), Egyptian (34.5%, a difference of 0.080%), and Salvadoran (34.5%, a difference of 0.12%).
| Demographics | Rating | Rank | In Labor Force | Age 16-19 |
| Immigrants | Chile | 2.0 /100 | #252 | Tragic 34.8% |
| Immigrants | Japan | 1.5 /100 | #253 | Tragic 34.7% |
| Bahamians | 1.4 /100 | #254 | Tragic 34.6% |
| Peruvians | 1.4 /100 | #255 | Tragic 34.6% |
| Immigrants | South Central Asia | 1.3 /100 | #256 | Tragic 34.6% |
| Immigrants | Egypt | 1.2 /100 | #257 | Tragic 34.6% |
| Thais | 1.2 /100 | #258 | Tragic 34.6% |
| Immigrants | Immigrants | 1.2 /100 | #259 | Tragic 34.6% |
| Egyptians | 1.2 /100 | #260 | Tragic 34.5% |
| Salvadorans | 1.1 /100 | #261 | Tragic 34.5% |
| Hispanics or Latinos | 1.1 /100 | #262 | Tragic 34.5% |
| Burmese | 1.1 /100 | #263 | Tragic 34.5% |
| Immigrants | Uruguay | 0.9 /100 | #264 | Tragic 34.4% |
| Immigrants | El Salvador | 0.7 /100 | #265 | Tragic 34.3% |
| Immigrants | Malaysia | 0.7 /100 | #266 | Tragic 34.3% |
Demographics Similar to Japanese by In Labor Force | Age 16-19
In terms of in labor force | age 16-19, the demographic groups most similar to Japanese are Paiute (37.5%, a difference of 0.0%), Pakistani (37.6%, a difference of 0.020%), Sierra Leonean (37.6%, a difference of 0.050%), Immigrants from Western Europe (37.5%, a difference of 0.050%), and Brazilian (37.5%, a difference of 0.080%).
| Demographics | Rating | Rank | In Labor Force | Age 16-19 |
| Cajuns | 93.2 /100 | #137 | Exceptional 37.8% |
| Comanche | 91.9 /100 | #138 | Exceptional 37.7% |
| Immigrants | Moldova | 91.9 /100 | #139 | Exceptional 37.7% |
| Estonians | 91.7 /100 | #140 | Exceptional 37.7% |
| Syrians | 90.7 /100 | #141 | Exceptional 37.6% |
| Sierra Leoneans | 89.7 /100 | #142 | Excellent 37.6% |
| Pakistanis | 89.5 /100 | #143 | Excellent 37.6% |
| Japanese | 89.3 /100 | #144 | Excellent 37.5% |
| Paiute | 89.3 /100 | #145 | Excellent 37.5% |
| Immigrants | Western Europe | 88.9 /100 | #146 | Excellent 37.5% |
| Brazilians | 88.7 /100 | #147 | Excellent 37.5% |
| Romanians | 87.3 /100 | #148 | Excellent 37.5% |
| Native Hawaiians | 85.0 /100 | #149 | Excellent 37.4% |
| Tsimshian | 84.7 /100 | #150 | Excellent 37.4% |
| Immigrants | Poland | 84.4 /100 | #151 | Excellent 37.3% |