Central American Indian vs Immigrants from Australia In Labor Force | Age 16-19
COMPARE
Central American Indian
Immigrants from Australia
In Labor Force | Age 16-19
In Labor Force | Age 16-19 Comparison
Central American Indians
Immigrants from Australia
34.1%
IN LABOR FORCE | AGE 16-19
0.4/ 100
METRIC RATING
271st/ 347
METRIC RANK
35.1%
IN LABOR FORCE | AGE 16-19
3.6/ 100
METRIC RATING
236th/ 347
METRIC RANK
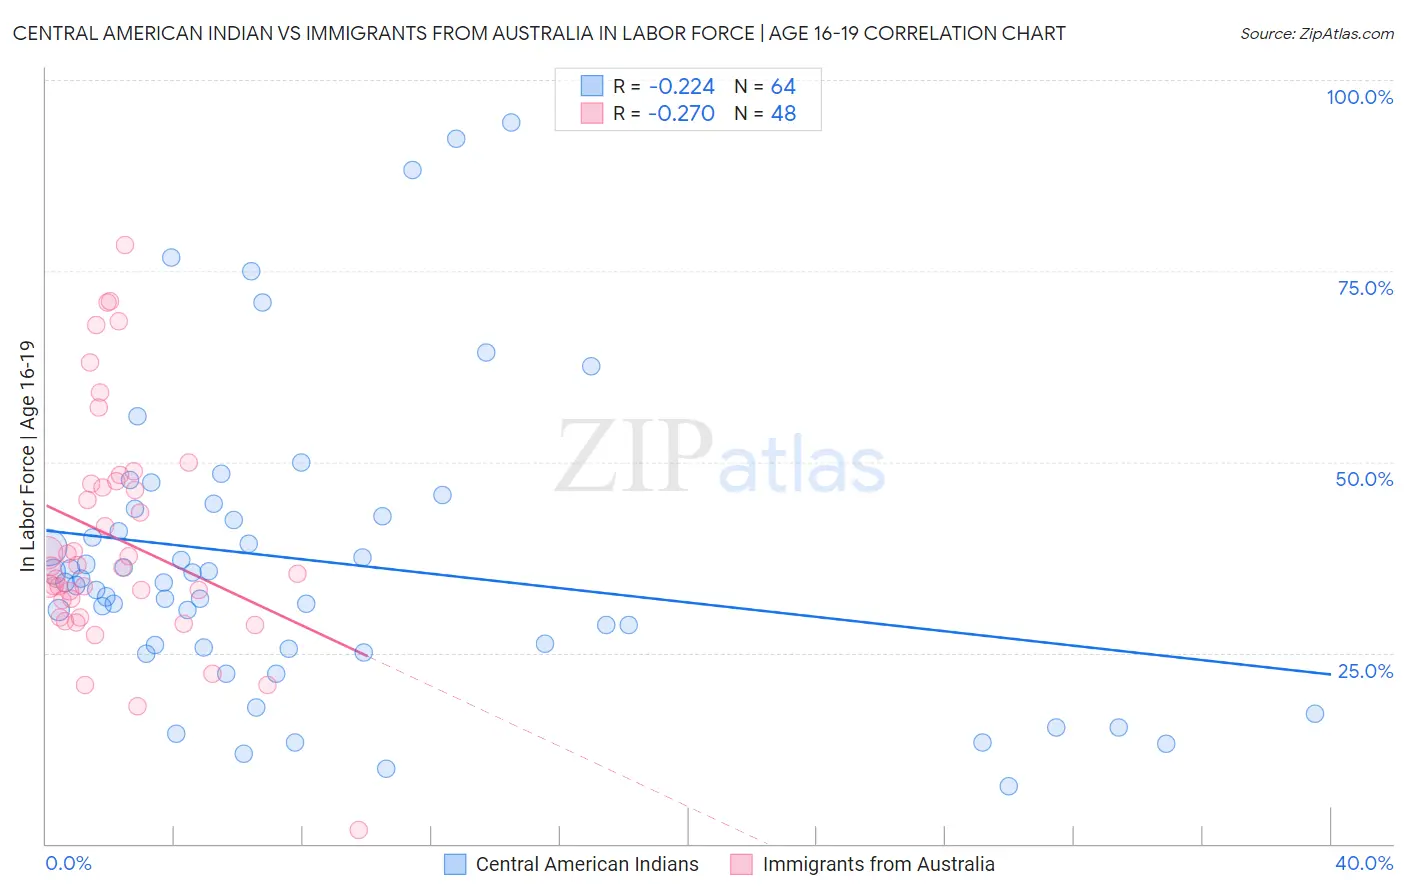
Central American Indian vs Immigrants from Australia In Labor Force | Age 16-19 Correlation Chart
The statistical analysis conducted on geographies consisting of 325,854,393 people shows a weak negative correlation between the proportion of Central American Indians and labor force participation rate among population between the ages 16 and 19 in the United States with a correlation coefficient (R) of -0.224 and weighted average of 34.1%. Similarly, the statistical analysis conducted on geographies consisting of 226,866,182 people shows a weak negative correlation between the proportion of Immigrants from Australia and labor force participation rate among population between the ages 16 and 19 in the United States with a correlation coefficient (R) of -0.270 and weighted average of 35.1%, a difference of 2.9%.
In Labor Force | Age 16-19 Correlation Summary
| Measurement | Central American Indian | Immigrants from Australia |
| Minimum | 7.5% | 1.8% |
| Maximum | 94.4% | 78.4% |
| Range | 86.9% | 76.6% |
| Mean | 37.0% | 39.9% |
| Median | 34.2% | 36.2% |
| Interquartile 25% (IQ1) | 25.6% | 30.8% |
| Interquartile 75% (IQ3) | 43.4% | 47.3% |
| Interquartile Range (IQR) | 17.8% | 16.5% |
| Standard Deviation (Sample) | 19.3% | 15.3% |
| Standard Deviation (Population) | 19.2% | 15.2% |
Similar Demographics by In Labor Force | Age 16-19
Demographics Similar to Central American Indians by In Labor Force | Age 16-19
In terms of in labor force | age 16-19, the demographic groups most similar to Central American Indians are Immigrants from Russia (34.1%, a difference of 0.0%), Asian (34.1%, a difference of 0.030%), Pima (34.1%, a difference of 0.050%), Immigrants from Asia (34.1%, a difference of 0.13%), and Immigrants from Panama (34.0%, a difference of 0.24%).
| Demographics | Rating | Rank | In Labor Force | Age 16-19 |
| Immigrants | Uruguay | 0.9 /100 | #264 | Tragic 34.4% |
| Immigrants | El Salvador | 0.7 /100 | #265 | Tragic 34.3% |
| Immigrants | Malaysia | 0.7 /100 | #266 | Tragic 34.3% |
| Immigrants | Peru | 0.5 /100 | #267 | Tragic 34.2% |
| Immigrants | Asia | 0.5 /100 | #268 | Tragic 34.1% |
| Pima | 0.5 /100 | #269 | Tragic 34.1% |
| Immigrants | Russia | 0.4 /100 | #270 | Tragic 34.1% |
| Central American Indians | 0.4 /100 | #271 | Tragic 34.1% |
| Asians | 0.4 /100 | #272 | Tragic 34.1% |
| Immigrants | Panama | 0.4 /100 | #273 | Tragic 34.0% |
| Venezuelans | 0.3 /100 | #274 | Tragic 34.0% |
| Immigrants | Fiji | 0.3 /100 | #275 | Tragic 33.9% |
| Immigrants | Latin America | 0.3 /100 | #276 | Tragic 33.9% |
| Menominee | 0.3 /100 | #277 | Tragic 33.9% |
| Colombians | 0.3 /100 | #278 | Tragic 33.8% |
Demographics Similar to Immigrants from Australia by In Labor Force | Age 16-19
In terms of in labor force | age 16-19, the demographic groups most similar to Immigrants from Australia are Immigrants from India (35.0%, a difference of 0.030%), Immigrants from Vietnam (35.0%, a difference of 0.070%), Immigrants from Philippines (35.1%, a difference of 0.14%), Inupiat (35.0%, a difference of 0.16%), and Immigrants from Mexico (35.1%, a difference of 0.22%).
| Demographics | Rating | Rank | In Labor Force | Age 16-19 |
| Immigrants | Lebanon | 5.0 /100 | #229 | Tragic 35.2% |
| Immigrants | Honduras | 4.9 /100 | #230 | Tragic 35.2% |
| Immigrants | Syria | 4.5 /100 | #231 | Tragic 35.2% |
| Immigrants | Kazakhstan | 4.5 /100 | #232 | Tragic 35.2% |
| Immigrants | France | 4.3 /100 | #233 | Tragic 35.1% |
| Immigrants | Mexico | 4.2 /100 | #234 | Tragic 35.1% |
| Immigrants | Philippines | 4.0 /100 | #235 | Tragic 35.1% |
| Immigrants | Australia | 3.6 /100 | #236 | Tragic 35.1% |
| Immigrants | India | 3.5 /100 | #237 | Tragic 35.0% |
| Immigrants | Vietnam | 3.4 /100 | #238 | Tragic 35.0% |
| Inupiat | 3.2 /100 | #239 | Tragic 35.0% |
| Immigrants | Central America | 3.0 /100 | #240 | Tragic 35.0% |
| Immigrants | Ireland | 2.9 /100 | #241 | Tragic 35.0% |
| Uruguayans | 2.6 /100 | #242 | Tragic 34.9% |
| Pueblo | 2.6 /100 | #243 | Tragic 34.9% |