Israeli vs West Indian In Labor Force | Age 35-44
COMPARE
Israeli
West Indian
In Labor Force | Age 35-44
In Labor Force | Age 35-44 Comparison
Israelis
West Indians
84.1%
IN LABOR FORCE | AGE 35-44
14.0/ 100
METRIC RATING
212th/ 347
METRIC RANK
83.9%
IN LABOR FORCE | AGE 35-44
2.4/ 100
METRIC RATING
236th/ 347
METRIC RANK
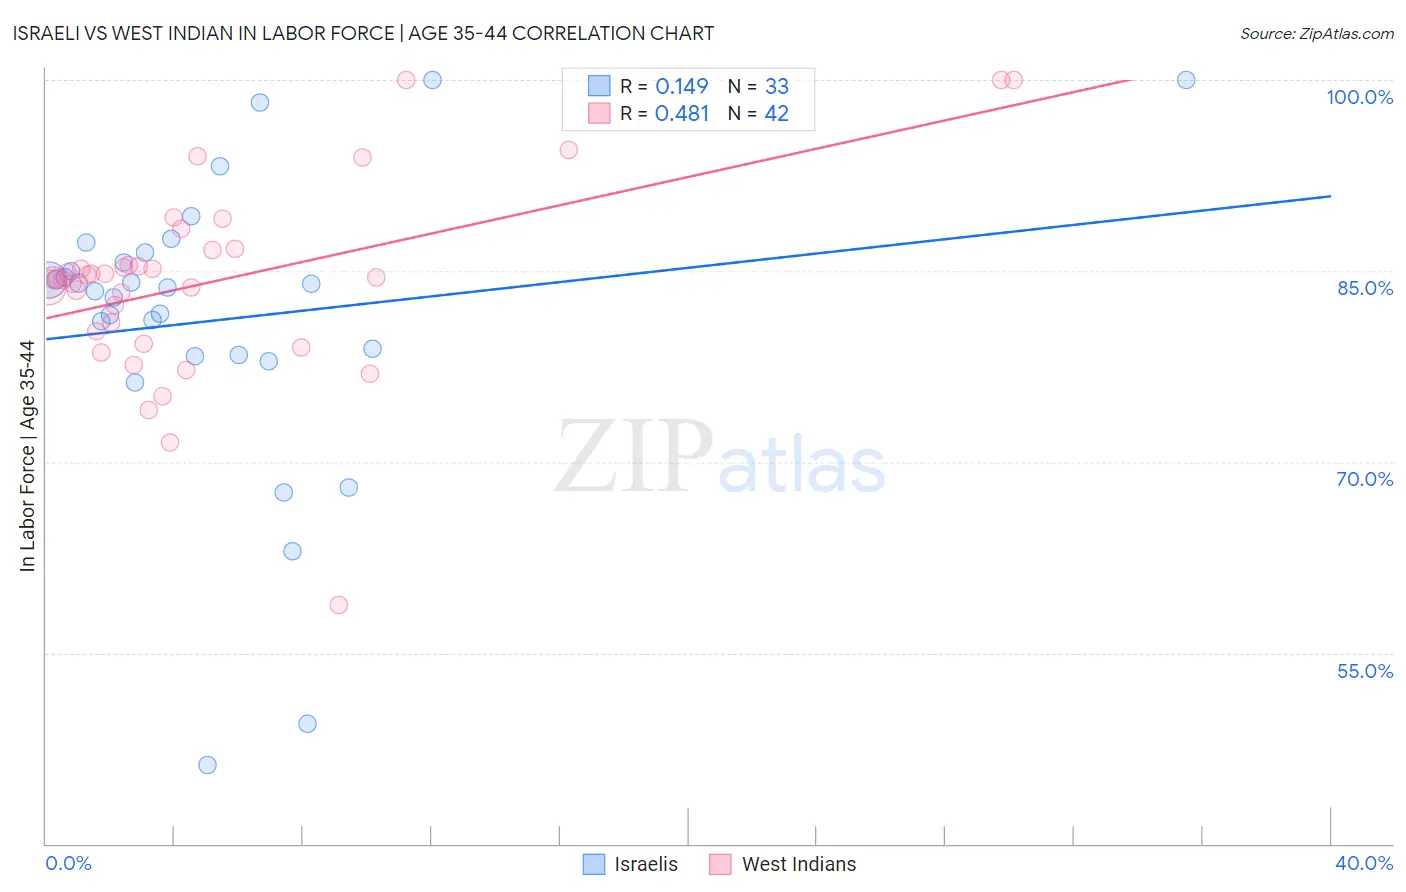
Israeli vs West Indian In Labor Force | Age 35-44 Correlation Chart
The statistical analysis conducted on geographies consisting of 211,041,916 people shows a poor positive correlation between the proportion of Israelis and labor force participation rate among population between the ages 35 and 44 in the United States with a correlation coefficient (R) of 0.149 and weighted average of 84.1%. Similarly, the statistical analysis conducted on geographies consisting of 253,906,051 people shows a moderate positive correlation between the proportion of West Indians and labor force participation rate among population between the ages 35 and 44 in the United States with a correlation coefficient (R) of 0.481 and weighted average of 83.9%, a difference of 0.31%.
In Labor Force | Age 35-44 Correlation Summary
| Measurement | Israeli | West Indian |
| Minimum | 46.2% | 58.8% |
| Maximum | 100.0% | 100.0% |
| Range | 53.8% | 41.2% |
| Mean | 81.1% | 84.2% |
| Median | 83.7% | 84.5% |
| Interquartile 25% (IQ1) | 78.3% | 80.3% |
| Interquartile 75% (IQ3) | 86.0% | 86.6% |
| Interquartile Range (IQR) | 7.7% | 6.3% |
| Standard Deviation (Sample) | 11.7% | 7.6% |
| Standard Deviation (Population) | 11.5% | 7.5% |
Similar Demographics by In Labor Force | Age 35-44
Demographics Similar to Israelis by In Labor Force | Age 35-44
In terms of in labor force | age 35-44, the demographic groups most similar to Israelis are Bangladeshi (84.1%, a difference of 0.0%), Immigrants from Ecuador (84.1%, a difference of 0.010%), Immigrants from Barbados (84.1%, a difference of 0.010%), New Zealander (84.1%, a difference of 0.030%), and European (84.1%, a difference of 0.030%).
| Demographics | Rating | Rank | In Labor Force | Age 35-44 |
| Immigrants | Canada | 19.6 /100 | #205 | Poor 84.2% |
| Immigrants | Costa Rica | 19.5 /100 | #206 | Poor 84.2% |
| Laotians | 19.0 /100 | #207 | Poor 84.2% |
| Immigrants | North America | 18.1 /100 | #208 | Poor 84.2% |
| Swiss | 17.4 /100 | #209 | Poor 84.2% |
| New Zealanders | 16.2 /100 | #210 | Poor 84.1% |
| Immigrants | Ecuador | 15.2 /100 | #211 | Poor 84.1% |
| Israelis | 14.0 /100 | #212 | Poor 84.1% |
| Bangladeshis | 13.7 /100 | #213 | Poor 84.1% |
| Immigrants | Barbados | 13.2 /100 | #214 | Poor 84.1% |
| Europeans | 12.2 /100 | #215 | Poor 84.1% |
| Nicaraguans | 12.1 /100 | #216 | Poor 84.1% |
| Immigrants | Norway | 11.7 /100 | #217 | Poor 84.1% |
| Immigrants | Nicaragua | 9.4 /100 | #218 | Tragic 84.1% |
| Sub-Saharan Africans | 9.3 /100 | #219 | Tragic 84.1% |
Demographics Similar to West Indians by In Labor Force | Age 35-44
In terms of in labor force | age 35-44, the demographic groups most similar to West Indians are Immigrants from Syria (83.9%, a difference of 0.0%), Immigrants from Oceania (83.9%, a difference of 0.020%), Immigrants from Germany (83.9%, a difference of 0.030%), Native Hawaiian (83.9%, a difference of 0.040%), and English (83.8%, a difference of 0.040%).
| Demographics | Rating | Rank | In Labor Force | Age 35-44 |
| Immigrants | Thailand | 4.7 /100 | #229 | Tragic 84.0% |
| Immigrants | Iraq | 3.7 /100 | #230 | Tragic 83.9% |
| Scottish | 3.2 /100 | #231 | Tragic 83.9% |
| Native Hawaiians | 3.0 /100 | #232 | Tragic 83.9% |
| Immigrants | Germany | 2.8 /100 | #233 | Tragic 83.9% |
| Immigrants | Oceania | 2.6 /100 | #234 | Tragic 83.9% |
| Immigrants | Syria | 2.5 /100 | #235 | Tragic 83.9% |
| West Indians | 2.4 /100 | #236 | Tragic 83.9% |
| English | 1.8 /100 | #237 | Tragic 83.8% |
| Immigrants | Laos | 1.7 /100 | #238 | Tragic 83.8% |
| Celtics | 1.4 /100 | #239 | Tragic 83.8% |
| Arabs | 1.3 /100 | #240 | Tragic 83.8% |
| Iraqis | 1.3 /100 | #241 | Tragic 83.8% |
| Immigrants | Cambodia | 1.1 /100 | #242 | Tragic 83.8% |
| Immigrants | Western Asia | 1.1 /100 | #243 | Tragic 83.8% |