Haitian vs Black/African American In Labor Force | Age 20-64
COMPARE
Haitian
Black/African American
In Labor Force | Age 20-64
In Labor Force | Age 20-64 Comparison
Haitians
Blacks/African Americans
79.3%
IN LABOR FORCE | AGE 20-64
16.1/ 100
METRIC RATING
210th/ 347
METRIC RANK
76.8%
IN LABOR FORCE | AGE 20-64
0.0/ 100
METRIC RATING
314th/ 347
METRIC RANK
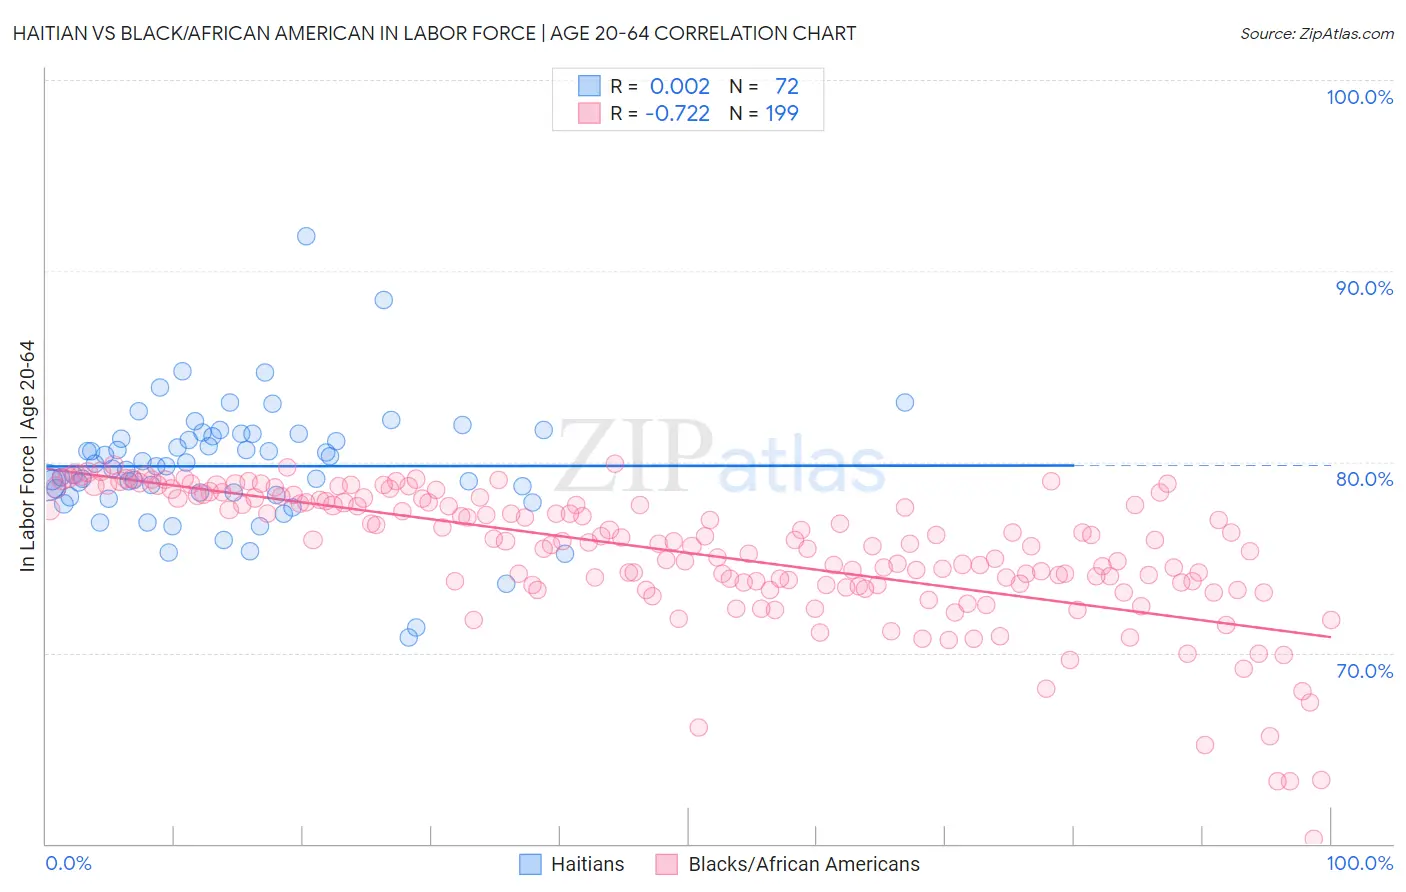
Haitian vs Black/African American In Labor Force | Age 20-64 Correlation Chart
The statistical analysis conducted on geographies consisting of 288,005,599 people shows no correlation between the proportion of Haitians and labor force participation rate among population between the ages 20 and 64 in the United States with a correlation coefficient (R) of 0.002 and weighted average of 79.3%. Similarly, the statistical analysis conducted on geographies consisting of 566,027,393 people shows a strong negative correlation between the proportion of Blacks/African Americans and labor force participation rate among population between the ages 20 and 64 in the United States with a correlation coefficient (R) of -0.722 and weighted average of 76.8%, a difference of 3.3%.
In Labor Force | Age 20-64 Correlation Summary
| Measurement | Haitian | Black/African American |
| Minimum | 70.8% | 60.2% |
| Maximum | 91.8% | 79.9% |
| Range | 21.0% | 19.7% |
| Mean | 79.8% | 75.3% |
| Median | 79.8% | 75.9% |
| Interquartile 25% (IQ1) | 78.3% | 73.6% |
| Interquartile 75% (IQ3) | 81.4% | 78.1% |
| Interquartile Range (IQR) | 3.1% | 4.5% |
| Standard Deviation (Sample) | 3.2% | 3.5% |
| Standard Deviation (Population) | 3.2% | 3.5% |
Similar Demographics by In Labor Force | Age 20-64
Demographics Similar to Haitians by In Labor Force | Age 20-64
In terms of in labor force | age 20-64, the demographic groups most similar to Haitians are Bangladeshi (79.3%, a difference of 0.0%), Immigrants from Ecuador (79.3%, a difference of 0.010%), Subsaharan African (79.3%, a difference of 0.010%), British (79.3%, a difference of 0.010%), and European (79.3%, a difference of 0.010%).
| Demographics | Rating | Rank | In Labor Force | Age 20-64 |
| Iraqis | 17.7 /100 | #203 | Poor 79.3% |
| Immigrants | Cambodia | 17.6 /100 | #204 | Poor 79.3% |
| Immigrants | Congo | 17.5 /100 | #205 | Poor 79.3% |
| Immigrants | Ecuador | 16.9 /100 | #206 | Poor 79.3% |
| Sub-Saharan Africans | 16.5 /100 | #207 | Poor 79.3% |
| British | 16.5 /100 | #208 | Poor 79.3% |
| Bangladeshis | 16.4 /100 | #209 | Poor 79.3% |
| Haitians | 16.1 /100 | #210 | Poor 79.3% |
| Europeans | 15.3 /100 | #211 | Poor 79.3% |
| Irish | 13.2 /100 | #212 | Poor 79.3% |
| Immigrants | Portugal | 12.8 /100 | #213 | Poor 79.3% |
| Immigrants | Armenia | 12.2 /100 | #214 | Poor 79.2% |
| Immigrants | Norway | 12.0 /100 | #215 | Poor 79.2% |
| Arabs | 11.4 /100 | #216 | Poor 79.2% |
| Immigrants | Western Asia | 11.0 /100 | #217 | Poor 79.2% |
Demographics Similar to Blacks/African Americans by In Labor Force | Age 20-64
In terms of in labor force | age 20-64, the demographic groups most similar to Blacks/African Americans are Shoshone (76.8%, a difference of 0.020%), Ottawa (76.7%, a difference of 0.10%), Alaskan Athabascan (76.9%, a difference of 0.14%), Yaqui (76.5%, a difference of 0.29%), and Blackfeet (77.0%, a difference of 0.31%).
| Demographics | Rating | Rank | In Labor Force | Age 20-64 |
| Central American Indians | 0.0 /100 | #307 | Tragic 77.1% |
| Alaska Natives | 0.0 /100 | #308 | Tragic 77.0% |
| Americans | 0.0 /100 | #309 | Tragic 77.0% |
| Comanche | 0.0 /100 | #310 | Tragic 77.0% |
| Blackfeet | 0.0 /100 | #311 | Tragic 77.0% |
| Alaskan Athabascans | 0.0 /100 | #312 | Tragic 76.9% |
| Shoshone | 0.0 /100 | #313 | Tragic 76.8% |
| Blacks/African Americans | 0.0 /100 | #314 | Tragic 76.8% |
| Ottawa | 0.0 /100 | #315 | Tragic 76.7% |
| Yaqui | 0.0 /100 | #316 | Tragic 76.5% |
| Cherokee | 0.0 /100 | #317 | Tragic 76.2% |
| Chickasaw | 0.0 /100 | #318 | Tragic 76.2% |
| Inupiat | 0.0 /100 | #319 | Tragic 76.1% |
| Yakama | 0.0 /100 | #320 | Tragic 75.8% |
| Seminole | 0.0 /100 | #321 | Tragic 75.5% |