Haitian vs Immigrants from Dominican Republic In Labor Force | Age 20-64
COMPARE
Haitian
Immigrants from Dominican Republic
In Labor Force | Age 20-64
In Labor Force | Age 20-64 Comparison
Haitians
Immigrants from Dominican Republic
79.3%
IN LABOR FORCE | AGE 20-64
16.1/ 100
METRIC RATING
210th/ 347
METRIC RANK
77.7%
IN LABOR FORCE | AGE 20-64
0.0/ 100
METRIC RATING
296th/ 347
METRIC RANK
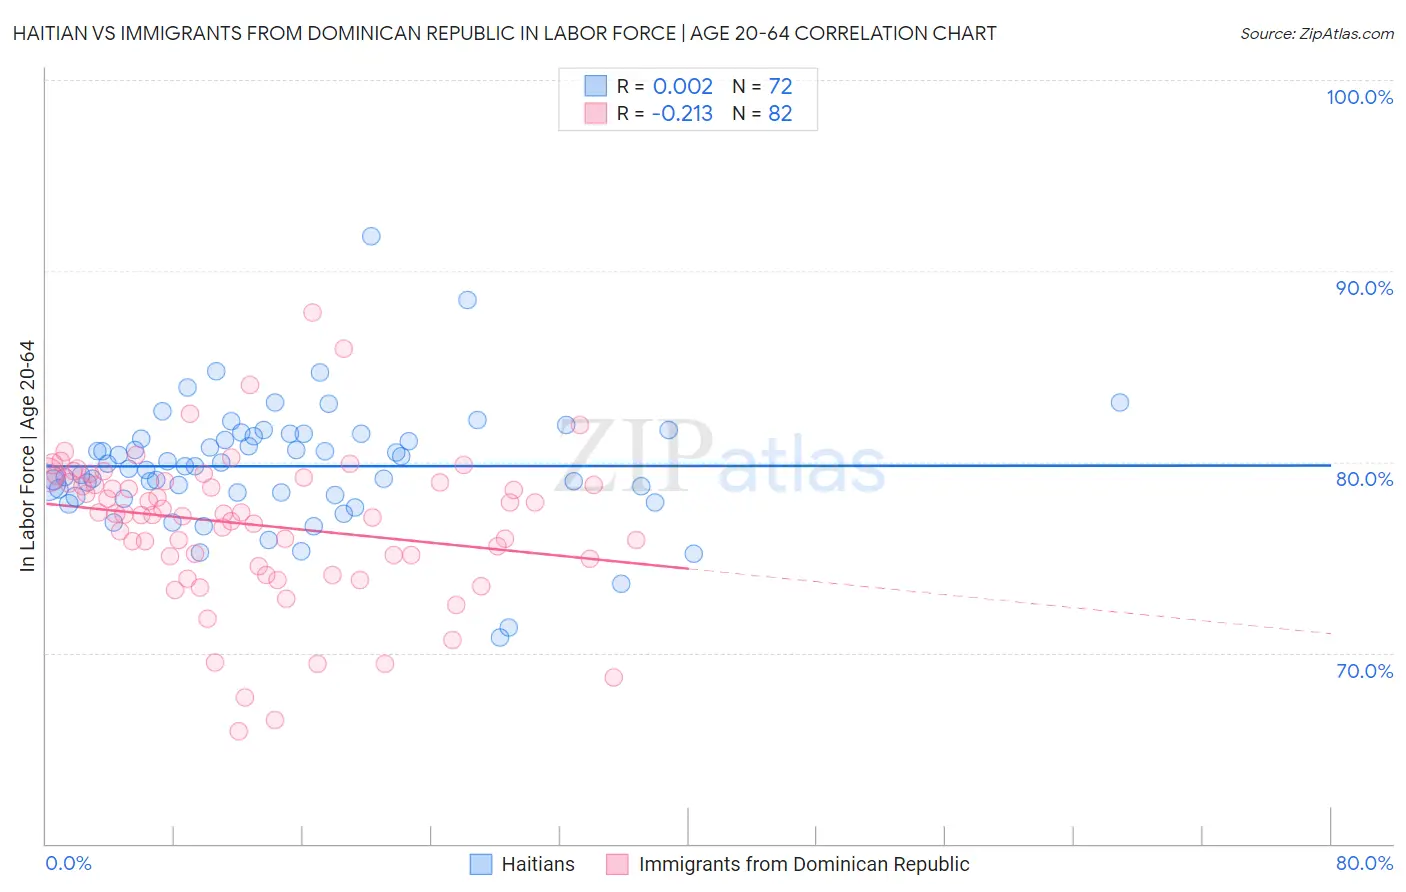
Haitian vs Immigrants from Dominican Republic In Labor Force | Age 20-64 Correlation Chart
The statistical analysis conducted on geographies consisting of 288,005,599 people shows no correlation between the proportion of Haitians and labor force participation rate among population between the ages 20 and 64 in the United States with a correlation coefficient (R) of 0.002 and weighted average of 79.3%. Similarly, the statistical analysis conducted on geographies consisting of 275,134,528 people shows a weak negative correlation between the proportion of Immigrants from Dominican Republic and labor force participation rate among population between the ages 20 and 64 in the United States with a correlation coefficient (R) of -0.213 and weighted average of 77.7%, a difference of 2.1%.
In Labor Force | Age 20-64 Correlation Summary
| Measurement | Haitian | Immigrants from Dominican Republic |
| Minimum | 70.8% | 65.9% |
| Maximum | 91.8% | 87.8% |
| Range | 21.0% | 21.9% |
| Mean | 79.8% | 76.7% |
| Median | 79.8% | 77.3% |
| Interquartile 25% (IQ1) | 78.3% | 74.9% |
| Interquartile 75% (IQ3) | 81.4% | 79.0% |
| Interquartile Range (IQR) | 3.1% | 4.1% |
| Standard Deviation (Sample) | 3.2% | 3.9% |
| Standard Deviation (Population) | 3.2% | 3.9% |
Similar Demographics by In Labor Force | Age 20-64
Demographics Similar to Haitians by In Labor Force | Age 20-64
In terms of in labor force | age 20-64, the demographic groups most similar to Haitians are Bangladeshi (79.3%, a difference of 0.0%), Immigrants from Ecuador (79.3%, a difference of 0.010%), Subsaharan African (79.3%, a difference of 0.010%), British (79.3%, a difference of 0.010%), and European (79.3%, a difference of 0.010%).
| Demographics | Rating | Rank | In Labor Force | Age 20-64 |
| Iraqis | 17.7 /100 | #203 | Poor 79.3% |
| Immigrants | Cambodia | 17.6 /100 | #204 | Poor 79.3% |
| Immigrants | Congo | 17.5 /100 | #205 | Poor 79.3% |
| Immigrants | Ecuador | 16.9 /100 | #206 | Poor 79.3% |
| Sub-Saharan Africans | 16.5 /100 | #207 | Poor 79.3% |
| British | 16.5 /100 | #208 | Poor 79.3% |
| Bangladeshis | 16.4 /100 | #209 | Poor 79.3% |
| Haitians | 16.1 /100 | #210 | Poor 79.3% |
| Europeans | 15.3 /100 | #211 | Poor 79.3% |
| Irish | 13.2 /100 | #212 | Poor 79.3% |
| Immigrants | Portugal | 12.8 /100 | #213 | Poor 79.3% |
| Immigrants | Armenia | 12.2 /100 | #214 | Poor 79.2% |
| Immigrants | Norway | 12.0 /100 | #215 | Poor 79.2% |
| Arabs | 11.4 /100 | #216 | Poor 79.2% |
| Immigrants | Western Asia | 11.0 /100 | #217 | Poor 79.2% |
Demographics Similar to Immigrants from Dominican Republic by In Labor Force | Age 20-64
In terms of in labor force | age 20-64, the demographic groups most similar to Immigrants from Dominican Republic are Dominican (77.7%, a difference of 0.010%), Cree (77.7%, a difference of 0.010%), Immigrants from Grenada (77.7%, a difference of 0.030%), Immigrants from Central America (77.7%, a difference of 0.070%), and Hispanic or Latino (77.6%, a difference of 0.070%).
| Demographics | Rating | Rank | In Labor Force | Age 20-64 |
| Africans | 0.0 /100 | #289 | Tragic 77.9% |
| Immigrants | Bangladesh | 0.0 /100 | #290 | Tragic 77.9% |
| Spanish Americans | 0.0 /100 | #291 | Tragic 77.8% |
| Immigrants | Azores | 0.0 /100 | #292 | Tragic 77.8% |
| Delaware | 0.0 /100 | #293 | Tragic 77.8% |
| Immigrants | Central America | 0.0 /100 | #294 | Tragic 77.7% |
| Immigrants | Grenada | 0.0 /100 | #295 | Tragic 77.7% |
| Immigrants | Dominican Republic | 0.0 /100 | #296 | Tragic 77.7% |
| Dominicans | 0.0 /100 | #297 | Tragic 77.7% |
| Cree | 0.0 /100 | #298 | Tragic 77.7% |
| Hispanics or Latinos | 0.0 /100 | #299 | Tragic 77.6% |
| Spanish American Indians | 0.0 /100 | #300 | Tragic 77.6% |
| Nepalese | 0.0 /100 | #301 | Tragic 77.5% |
| Iroquois | 0.0 /100 | #302 | Tragic 77.5% |
| Chippewa | 0.0 /100 | #303 | Tragic 77.3% |