Guyanese vs Estonian In Labor Force | Age 25-29
COMPARE
Guyanese
Estonian
In Labor Force | Age 25-29
In Labor Force | Age 25-29 Comparison
Guyanese
Estonians
83.0%
IN LABOR FORCE | AGE 25-29
0.0/ 100
METRIC RATING
287th/ 347
METRIC RANK
85.5%
IN LABOR FORCE | AGE 25-29
99.6/ 100
METRIC RATING
57th/ 347
METRIC RANK
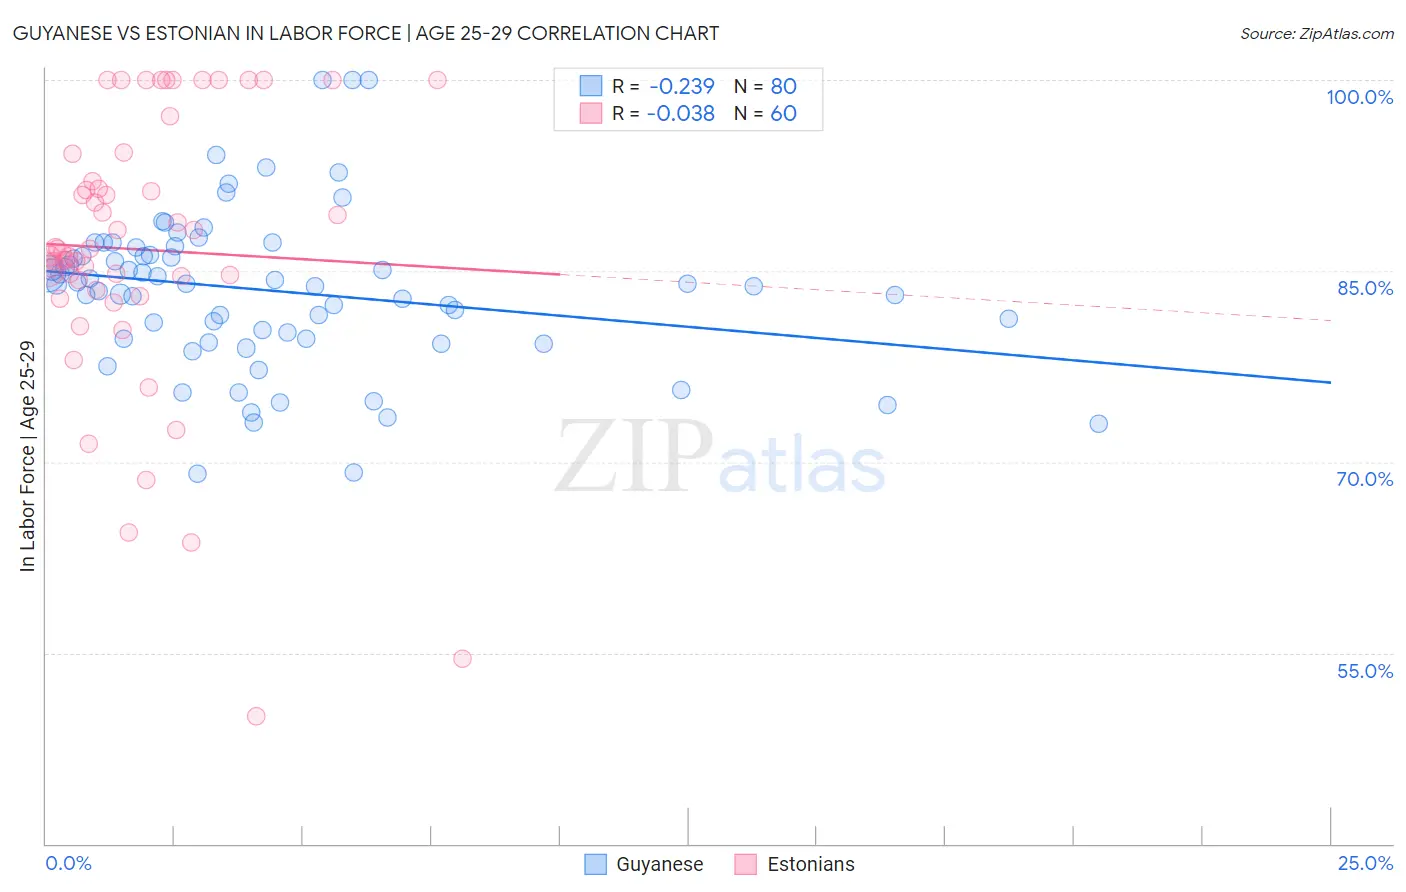
Guyanese vs Estonian In Labor Force | Age 25-29 Correlation Chart
The statistical analysis conducted on geographies consisting of 176,912,088 people shows a weak negative correlation between the proportion of Guyanese and labor force participation rate among population between the ages 25 and 29 in the United States with a correlation coefficient (R) of -0.239 and weighted average of 83.0%. Similarly, the statistical analysis conducted on geographies consisting of 123,516,620 people shows no correlation between the proportion of Estonians and labor force participation rate among population between the ages 25 and 29 in the United States with a correlation coefficient (R) of -0.038 and weighted average of 85.5%, a difference of 3.0%.
In Labor Force | Age 25-29 Correlation Summary
| Measurement | Guyanese | Estonian |
| Minimum | 69.1% | 50.0% |
| Maximum | 100.0% | 100.0% |
| Range | 30.9% | 50.0% |
| Mean | 83.4% | 86.7% |
| Median | 84.0% | 86.6% |
| Interquartile 25% (IQ1) | 79.7% | 83.9% |
| Interquartile 75% (IQ3) | 86.5% | 93.1% |
| Interquartile Range (IQR) | 6.8% | 9.2% |
| Standard Deviation (Sample) | 6.2% | 10.9% |
| Standard Deviation (Population) | 6.2% | 10.8% |
Similar Demographics by In Labor Force | Age 25-29
Demographics Similar to Guyanese by In Labor Force | Age 25-29
In terms of in labor force | age 25-29, the demographic groups most similar to Guyanese are Mexican American Indian (83.0%, a difference of 0.020%), Belizean (83.1%, a difference of 0.030%), Ottawa (83.0%, a difference of 0.030%), Immigrants from Micronesia (83.0%, a difference of 0.050%), and Nicaraguan (83.1%, a difference of 0.070%).
| Demographics | Rating | Rank | In Labor Force | Age 25-29 |
| Dominicans | 0.0 /100 | #280 | Tragic 83.2% |
| Immigrants | Dominican Republic | 0.0 /100 | #281 | Tragic 83.1% |
| Americans | 0.0 /100 | #282 | Tragic 83.1% |
| Immigrants | Azores | 0.0 /100 | #283 | Tragic 83.1% |
| Nicaraguans | 0.0 /100 | #284 | Tragic 83.1% |
| Belizeans | 0.0 /100 | #285 | Tragic 83.1% |
| Mexican American Indians | 0.0 /100 | #286 | Tragic 83.0% |
| Guyanese | 0.0 /100 | #287 | Tragic 83.0% |
| Ottawa | 0.0 /100 | #288 | Tragic 83.0% |
| Immigrants | Micronesia | 0.0 /100 | #289 | Tragic 83.0% |
| Immigrants | Bangladesh | 0.0 /100 | #290 | Tragic 83.0% |
| Hawaiians | 0.0 /100 | #291 | Tragic 83.0% |
| Immigrants | Guyana | 0.0 /100 | #292 | Tragic 83.0% |
| Immigrants | Latin America | 0.0 /100 | #293 | Tragic 82.9% |
| Nepalese | 0.0 /100 | #294 | Tragic 82.9% |
Demographics Similar to Estonians by In Labor Force | Age 25-29
In terms of in labor force | age 25-29, the demographic groups most similar to Estonians are Eastern European (85.5%, a difference of 0.010%), Greek (85.5%, a difference of 0.010%), Immigrants from Morocco (85.5%, a difference of 0.010%), Immigrants from Brazil (85.5%, a difference of 0.040%), and Thai (85.5%, a difference of 0.040%).
| Demographics | Rating | Rank | In Labor Force | Age 25-29 |
| Yugoslavians | 99.8 /100 | #50 | Exceptional 85.6% |
| Immigrants | Latvia | 99.8 /100 | #51 | Exceptional 85.6% |
| Immigrants | Poland | 99.7 /100 | #52 | Exceptional 85.6% |
| Belgians | 99.7 /100 | #53 | Exceptional 85.5% |
| Albanians | 99.7 /100 | #54 | Exceptional 85.5% |
| Immigrants | Brazil | 99.7 /100 | #55 | Exceptional 85.5% |
| Eastern Europeans | 99.6 /100 | #56 | Exceptional 85.5% |
| Estonians | 99.6 /100 | #57 | Exceptional 85.5% |
| Greeks | 99.6 /100 | #58 | Exceptional 85.5% |
| Immigrants | Morocco | 99.5 /100 | #59 | Exceptional 85.5% |
| Thais | 99.5 /100 | #60 | Exceptional 85.5% |
| Serbians | 99.5 /100 | #61 | Exceptional 85.5% |
| Taiwanese | 99.4 /100 | #62 | Exceptional 85.4% |
| Immigrants | Kenya | 99.4 /100 | #63 | Exceptional 85.4% |
| Immigrants | Italy | 99.3 /100 | #64 | Exceptional 85.4% |