Guyanese vs Australian In Labor Force | Age 25-29
COMPARE
Guyanese
Australian
In Labor Force | Age 25-29
In Labor Force | Age 25-29 Comparison
Guyanese
Australians
83.0%
IN LABOR FORCE | AGE 25-29
0.0/ 100
METRIC RATING
287th/ 347
METRIC RANK
84.9%
IN LABOR FORCE | AGE 25-29
83.6/ 100
METRIC RATING
128th/ 347
METRIC RANK
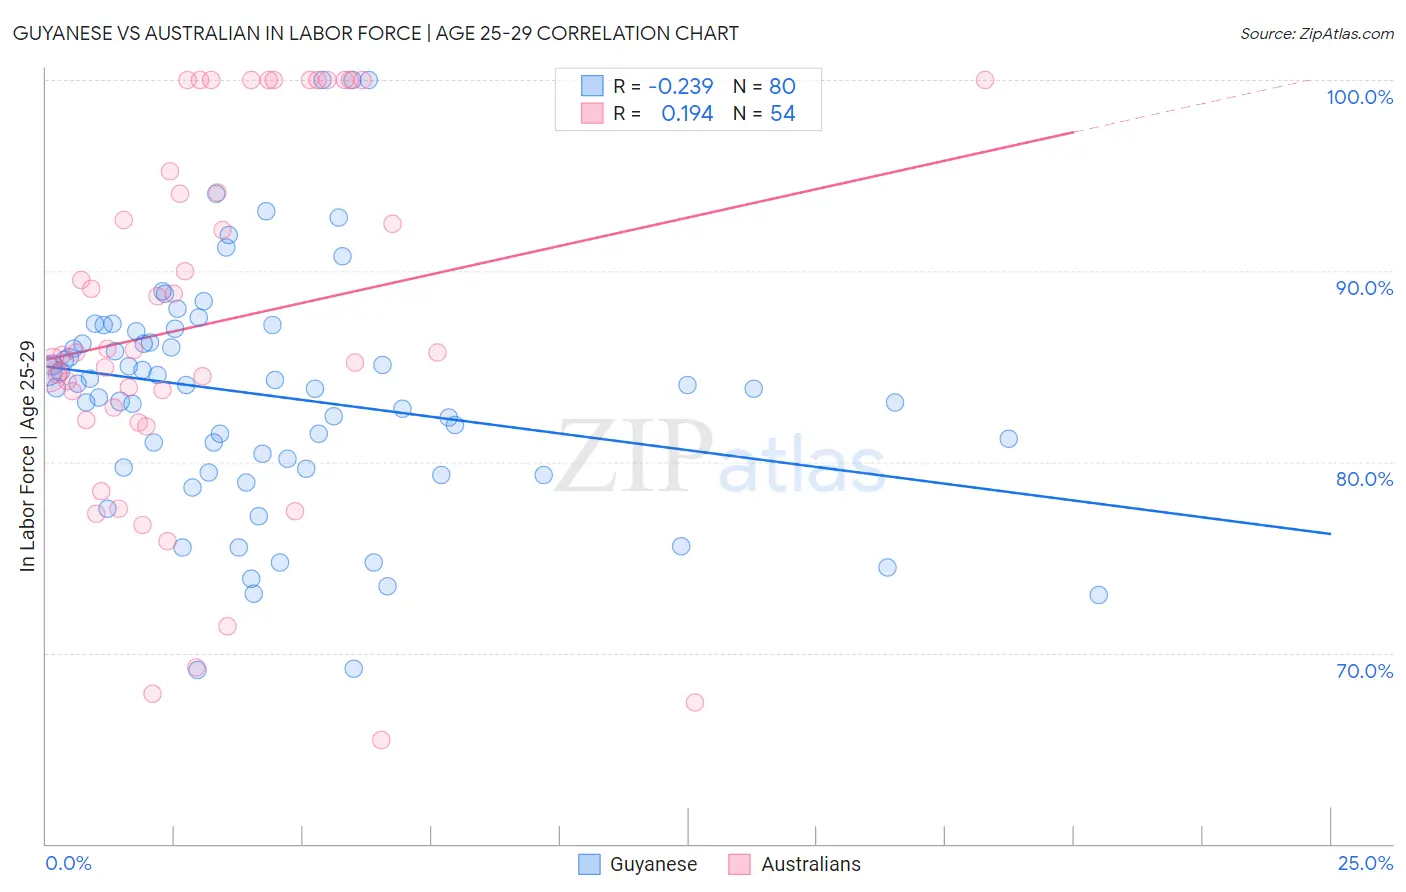
Guyanese vs Australian In Labor Force | Age 25-29 Correlation Chart
The statistical analysis conducted on geographies consisting of 176,912,088 people shows a weak negative correlation between the proportion of Guyanese and labor force participation rate among population between the ages 25 and 29 in the United States with a correlation coefficient (R) of -0.239 and weighted average of 83.0%. Similarly, the statistical analysis conducted on geographies consisting of 224,101,072 people shows a poor positive correlation between the proportion of Australians and labor force participation rate among population between the ages 25 and 29 in the United States with a correlation coefficient (R) of 0.194 and weighted average of 84.9%, a difference of 2.2%.
In Labor Force | Age 25-29 Correlation Summary
| Measurement | Guyanese | Australian |
| Minimum | 69.1% | 65.4% |
| Maximum | 100.0% | 100.0% |
| Range | 30.9% | 34.6% |
| Mean | 83.4% | 87.3% |
| Median | 84.0% | 85.7% |
| Interquartile 25% (IQ1) | 79.7% | 82.2% |
| Interquartile 75% (IQ3) | 86.5% | 95.2% |
| Interquartile Range (IQR) | 6.8% | 13.0% |
| Standard Deviation (Sample) | 6.2% | 9.7% |
| Standard Deviation (Population) | 6.2% | 9.6% |
Similar Demographics by In Labor Force | Age 25-29
Demographics Similar to Guyanese by In Labor Force | Age 25-29
In terms of in labor force | age 25-29, the demographic groups most similar to Guyanese are Mexican American Indian (83.0%, a difference of 0.020%), Belizean (83.1%, a difference of 0.030%), Ottawa (83.0%, a difference of 0.030%), Immigrants from Micronesia (83.0%, a difference of 0.050%), and Nicaraguan (83.1%, a difference of 0.070%).
| Demographics | Rating | Rank | In Labor Force | Age 25-29 |
| Dominicans | 0.0 /100 | #280 | Tragic 83.2% |
| Immigrants | Dominican Republic | 0.0 /100 | #281 | Tragic 83.1% |
| Americans | 0.0 /100 | #282 | Tragic 83.1% |
| Immigrants | Azores | 0.0 /100 | #283 | Tragic 83.1% |
| Nicaraguans | 0.0 /100 | #284 | Tragic 83.1% |
| Belizeans | 0.0 /100 | #285 | Tragic 83.1% |
| Mexican American Indians | 0.0 /100 | #286 | Tragic 83.0% |
| Guyanese | 0.0 /100 | #287 | Tragic 83.0% |
| Ottawa | 0.0 /100 | #288 | Tragic 83.0% |
| Immigrants | Micronesia | 0.0 /100 | #289 | Tragic 83.0% |
| Immigrants | Bangladesh | 0.0 /100 | #290 | Tragic 83.0% |
| Hawaiians | 0.0 /100 | #291 | Tragic 83.0% |
| Immigrants | Guyana | 0.0 /100 | #292 | Tragic 83.0% |
| Immigrants | Latin America | 0.0 /100 | #293 | Tragic 82.9% |
| Nepalese | 0.0 /100 | #294 | Tragic 82.9% |
Demographics Similar to Australians by In Labor Force | Age 25-29
In terms of in labor force | age 25-29, the demographic groups most similar to Australians are Uruguayan (84.9%, a difference of 0.010%), Immigrants from Singapore (84.9%, a difference of 0.010%), Immigrants from Uruguay (84.9%, a difference of 0.010%), Scandinavian (84.9%, a difference of 0.020%), and Dutch (84.9%, a difference of 0.020%).
| Demographics | Rating | Rank | In Labor Force | Age 25-29 |
| Immigrants | Chile | 85.6 /100 | #121 | Excellent 84.9% |
| Scandinavians | 85.1 /100 | #122 | Excellent 84.9% |
| Dutch | 84.9 /100 | #123 | Excellent 84.9% |
| Immigrants | Iran | 84.8 /100 | #124 | Excellent 84.9% |
| Uruguayans | 84.7 /100 | #125 | Excellent 84.9% |
| Immigrants | Singapore | 84.4 /100 | #126 | Excellent 84.9% |
| Immigrants | Uruguay | 84.0 /100 | #127 | Excellent 84.9% |
| Australians | 83.6 /100 | #128 | Excellent 84.9% |
| Immigrants | Russia | 81.6 /100 | #129 | Excellent 84.9% |
| Northern Europeans | 81.3 /100 | #130 | Excellent 84.9% |
| Iranians | 78.1 /100 | #131 | Good 84.8% |
| Romanians | 77.7 /100 | #132 | Good 84.8% |
| Asians | 77.7 /100 | #133 | Good 84.8% |
| Syrians | 76.5 /100 | #134 | Good 84.8% |
| Immigrants | Hungary | 76.4 /100 | #135 | Good 84.8% |