Immigrants from North Macedonia vs Estonian In Labor Force | Age 25-29
COMPARE
Immigrants from North Macedonia
Estonian
In Labor Force | Age 25-29
In Labor Force | Age 25-29 Comparison
Immigrants from North Macedonia
Estonians
85.9%
IN LABOR FORCE | AGE 25-29
100.0/ 100
METRIC RATING
26th/ 347
METRIC RANK
85.5%
IN LABOR FORCE | AGE 25-29
99.6/ 100
METRIC RATING
57th/ 347
METRIC RANK
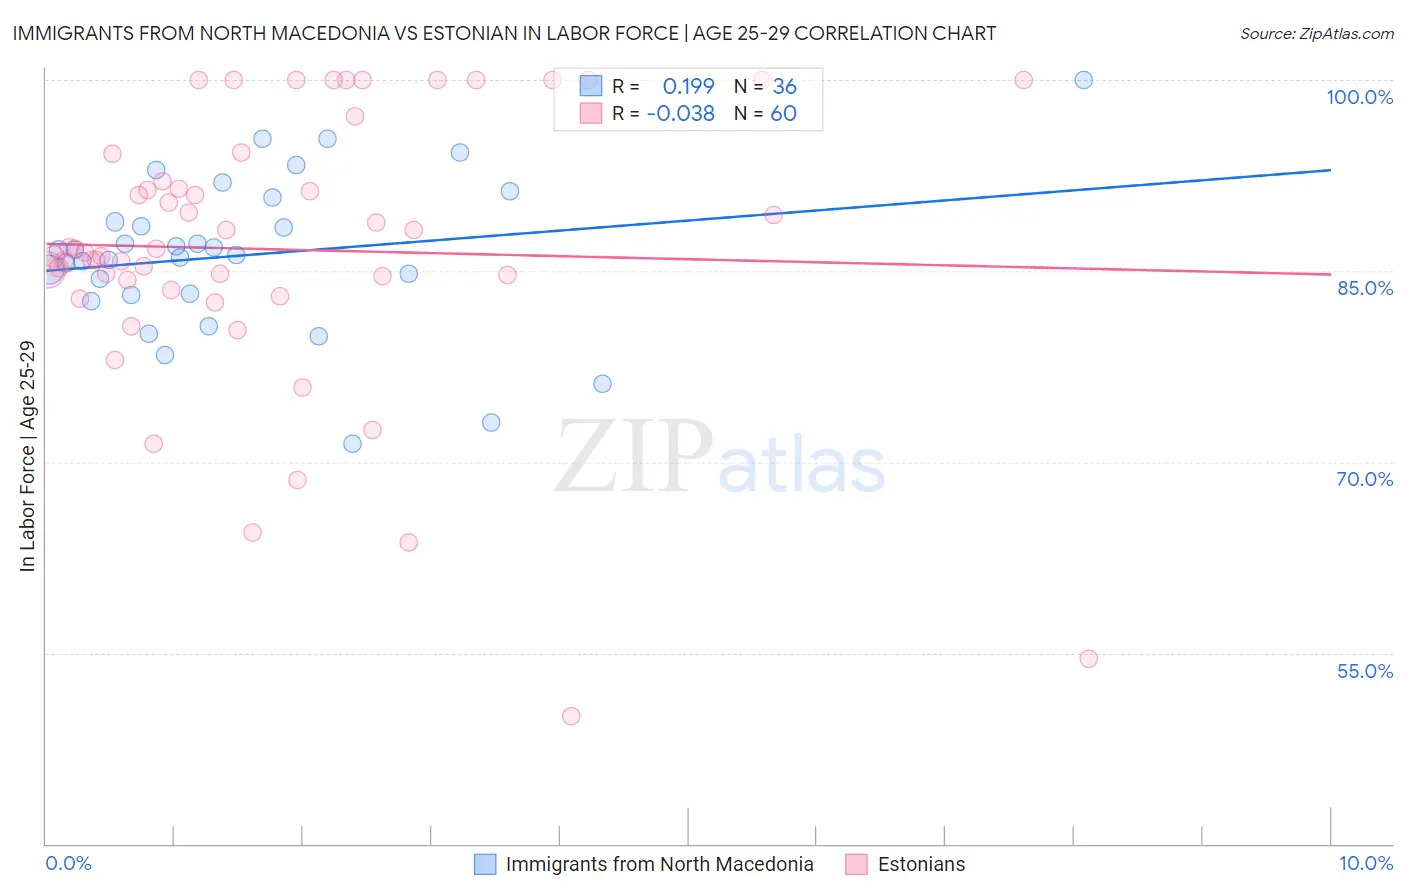
Immigrants from North Macedonia vs Estonian In Labor Force | Age 25-29 Correlation Chart
The statistical analysis conducted on geographies consisting of 74,314,976 people shows a poor positive correlation between the proportion of Immigrants from North Macedonia and labor force participation rate among population between the ages 25 and 29 in the United States with a correlation coefficient (R) of 0.199 and weighted average of 85.9%. Similarly, the statistical analysis conducted on geographies consisting of 123,516,620 people shows no correlation between the proportion of Estonians and labor force participation rate among population between the ages 25 and 29 in the United States with a correlation coefficient (R) of -0.038 and weighted average of 85.5%, a difference of 0.47%.
In Labor Force | Age 25-29 Correlation Summary
| Measurement | Immigrants from North Macedonia | Estonian |
| Minimum | 71.4% | 50.0% |
| Maximum | 100.0% | 100.0% |
| Range | 28.6% | 50.0% |
| Mean | 86.3% | 86.7% |
| Median | 86.4% | 86.6% |
| Interquartile 25% (IQ1) | 83.2% | 83.9% |
| Interquartile 75% (IQ3) | 89.8% | 93.1% |
| Interquartile Range (IQR) | 6.6% | 9.2% |
| Standard Deviation (Sample) | 6.1% | 10.9% |
| Standard Deviation (Population) | 6.1% | 10.8% |
Similar Demographics by In Labor Force | Age 25-29
Demographics Similar to Immigrants from North Macedonia by In Labor Force | Age 25-29
In terms of in labor force | age 25-29, the demographic groups most similar to Immigrants from North Macedonia are Paraguayan (85.9%, a difference of 0.010%), Ugandan (85.9%, a difference of 0.020%), Immigrants from Liberia (85.9%, a difference of 0.020%), Sudanese (85.9%, a difference of 0.060%), and Immigrants from Serbia (85.9%, a difference of 0.060%).
| Demographics | Rating | Rank | In Labor Force | Age 25-29 |
| Cape Verdeans | 100.0 /100 | #19 | Exceptional 86.0% |
| Immigrants | Ireland | 100.0 /100 | #20 | Exceptional 86.0% |
| Maltese | 100.0 /100 | #21 | Exceptional 86.0% |
| Cambodians | 100.0 /100 | #22 | Exceptional 86.0% |
| Immigrants | Uganda | 100.0 /100 | #23 | Exceptional 86.0% |
| Immigrants | Eastern Africa | 100.0 /100 | #24 | Exceptional 86.0% |
| Sudanese | 100.0 /100 | #25 | Exceptional 85.9% |
| Immigrants | North Macedonia | 100.0 /100 | #26 | Exceptional 85.9% |
| Paraguayans | 100.0 /100 | #27 | Exceptional 85.9% |
| Ugandans | 100.0 /100 | #28 | Exceptional 85.9% |
| Immigrants | Liberia | 100.0 /100 | #29 | Exceptional 85.9% |
| Immigrants | Serbia | 100.0 /100 | #30 | Exceptional 85.9% |
| German Russians | 100.0 /100 | #31 | Exceptional 85.8% |
| Slovaks | 100.0 /100 | #32 | Exceptional 85.8% |
| Immigrants | Bulgaria | 100.0 /100 | #33 | Exceptional 85.8% |
Demographics Similar to Estonians by In Labor Force | Age 25-29
In terms of in labor force | age 25-29, the demographic groups most similar to Estonians are Eastern European (85.5%, a difference of 0.010%), Greek (85.5%, a difference of 0.010%), Immigrants from Morocco (85.5%, a difference of 0.010%), Immigrants from Brazil (85.5%, a difference of 0.040%), and Thai (85.5%, a difference of 0.040%).
| Demographics | Rating | Rank | In Labor Force | Age 25-29 |
| Yugoslavians | 99.8 /100 | #50 | Exceptional 85.6% |
| Immigrants | Latvia | 99.8 /100 | #51 | Exceptional 85.6% |
| Immigrants | Poland | 99.7 /100 | #52 | Exceptional 85.6% |
| Belgians | 99.7 /100 | #53 | Exceptional 85.5% |
| Albanians | 99.7 /100 | #54 | Exceptional 85.5% |
| Immigrants | Brazil | 99.7 /100 | #55 | Exceptional 85.5% |
| Eastern Europeans | 99.6 /100 | #56 | Exceptional 85.5% |
| Estonians | 99.6 /100 | #57 | Exceptional 85.5% |
| Greeks | 99.6 /100 | #58 | Exceptional 85.5% |
| Immigrants | Morocco | 99.5 /100 | #59 | Exceptional 85.5% |
| Thais | 99.5 /100 | #60 | Exceptional 85.5% |
| Serbians | 99.5 /100 | #61 | Exceptional 85.5% |
| Taiwanese | 99.4 /100 | #62 | Exceptional 85.4% |
| Immigrants | Kenya | 99.4 /100 | #63 | Exceptional 85.4% |
| Immigrants | Italy | 99.3 /100 | #64 | Exceptional 85.4% |