Swedish vs Australian In Labor Force | Age 25-29
COMPARE
Swedish
Australian
In Labor Force | Age 25-29
In Labor Force | Age 25-29 Comparison
Swedes
Australians
85.6%
IN LABOR FORCE | AGE 25-29
99.8/ 100
METRIC RATING
49th/ 347
METRIC RANK
84.9%
IN LABOR FORCE | AGE 25-29
83.6/ 100
METRIC RATING
128th/ 347
METRIC RANK
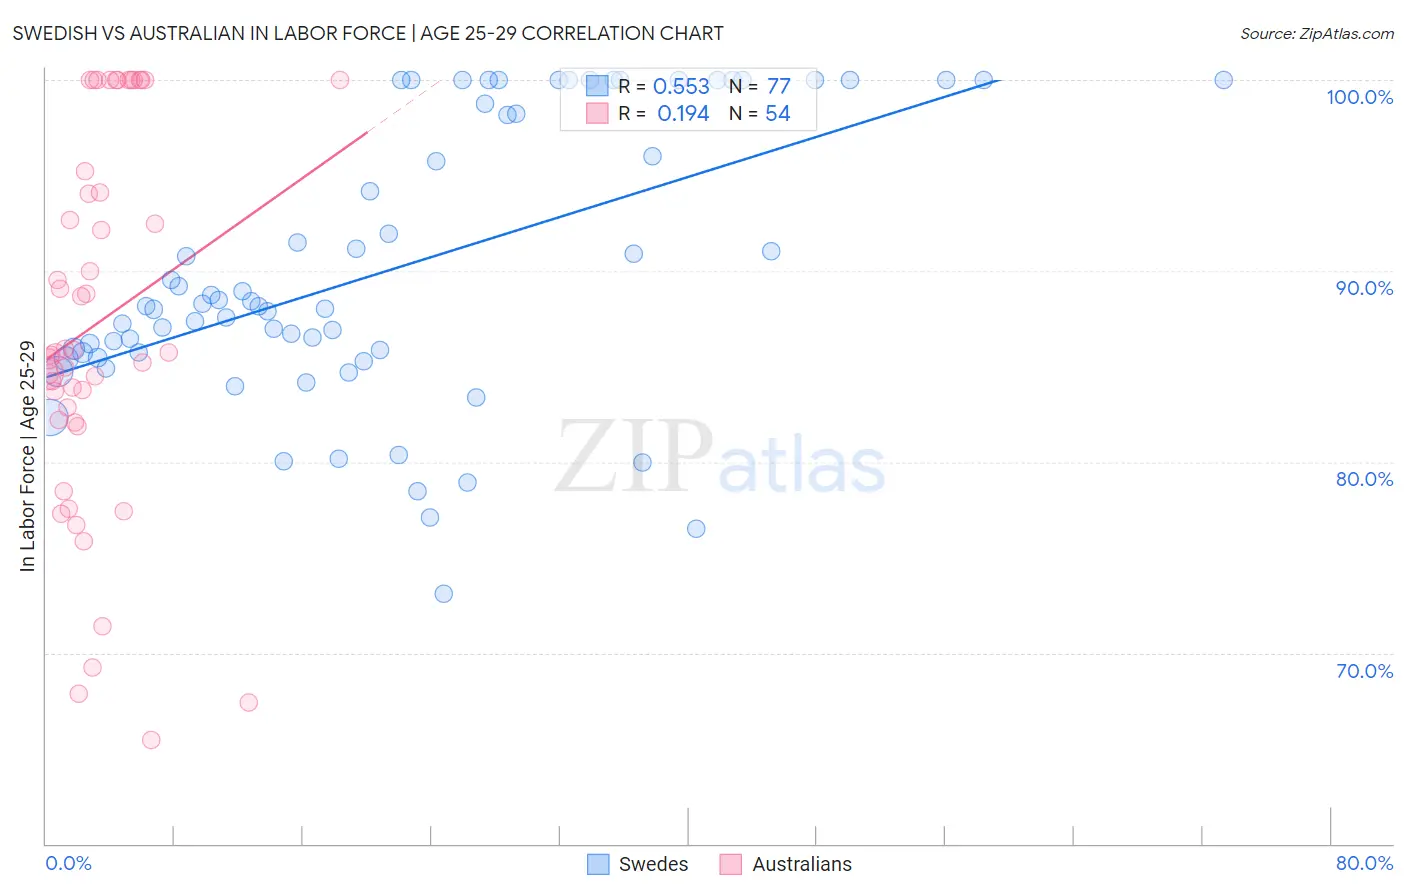
Swedish vs Australian In Labor Force | Age 25-29 Correlation Chart
The statistical analysis conducted on geographies consisting of 538,345,964 people shows a substantial positive correlation between the proportion of Swedes and labor force participation rate among population between the ages 25 and 29 in the United States with a correlation coefficient (R) of 0.553 and weighted average of 85.6%. Similarly, the statistical analysis conducted on geographies consisting of 224,101,072 people shows a poor positive correlation between the proportion of Australians and labor force participation rate among population between the ages 25 and 29 in the United States with a correlation coefficient (R) of 0.194 and weighted average of 84.9%, a difference of 0.83%.
In Labor Force | Age 25-29 Correlation Summary
| Measurement | Swedish | Australian |
| Minimum | 73.1% | 65.4% |
| Maximum | 100.0% | 100.0% |
| Range | 26.9% | 34.6% |
| Mean | 90.1% | 87.3% |
| Median | 88.2% | 85.7% |
| Interquartile 25% (IQ1) | 85.6% | 82.2% |
| Interquartile 75% (IQ3) | 99.4% | 95.2% |
| Interquartile Range (IQR) | 13.8% | 13.0% |
| Standard Deviation (Sample) | 7.3% | 9.7% |
| Standard Deviation (Population) | 7.2% | 9.6% |
Similar Demographics by In Labor Force | Age 25-29
Demographics Similar to Swedes by In Labor Force | Age 25-29
In terms of in labor force | age 25-29, the demographic groups most similar to Swedes are Italian (85.6%, a difference of 0.010%), Turkish (85.6%, a difference of 0.020%), Yugoslavian (85.6%, a difference of 0.030%), Immigrants from Latvia (85.6%, a difference of 0.030%), and Czech (85.6%, a difference of 0.040%).
| Demographics | Rating | Rank | In Labor Force | Age 25-29 |
| Immigrants | Eritrea | 99.9 /100 | #42 | Exceptional 85.7% |
| Immigrants | India | 99.9 /100 | #43 | Exceptional 85.7% |
| Macedonians | 99.9 /100 | #44 | Exceptional 85.7% |
| Immigrants | Sierra Leone | 99.9 /100 | #45 | Exceptional 85.7% |
| Czechs | 99.8 /100 | #46 | Exceptional 85.6% |
| Turks | 99.8 /100 | #47 | Exceptional 85.6% |
| Italians | 99.8 /100 | #48 | Exceptional 85.6% |
| Swedes | 99.8 /100 | #49 | Exceptional 85.6% |
| Yugoslavians | 99.8 /100 | #50 | Exceptional 85.6% |
| Immigrants | Latvia | 99.8 /100 | #51 | Exceptional 85.6% |
| Immigrants | Poland | 99.7 /100 | #52 | Exceptional 85.6% |
| Belgians | 99.7 /100 | #53 | Exceptional 85.5% |
| Albanians | 99.7 /100 | #54 | Exceptional 85.5% |
| Immigrants | Brazil | 99.7 /100 | #55 | Exceptional 85.5% |
| Eastern Europeans | 99.6 /100 | #56 | Exceptional 85.5% |
Demographics Similar to Australians by In Labor Force | Age 25-29
In terms of in labor force | age 25-29, the demographic groups most similar to Australians are Uruguayan (84.9%, a difference of 0.010%), Immigrants from Singapore (84.9%, a difference of 0.010%), Immigrants from Uruguay (84.9%, a difference of 0.010%), Scandinavian (84.9%, a difference of 0.020%), and Dutch (84.9%, a difference of 0.020%).
| Demographics | Rating | Rank | In Labor Force | Age 25-29 |
| Immigrants | Chile | 85.6 /100 | #121 | Excellent 84.9% |
| Scandinavians | 85.1 /100 | #122 | Excellent 84.9% |
| Dutch | 84.9 /100 | #123 | Excellent 84.9% |
| Immigrants | Iran | 84.8 /100 | #124 | Excellent 84.9% |
| Uruguayans | 84.7 /100 | #125 | Excellent 84.9% |
| Immigrants | Singapore | 84.4 /100 | #126 | Excellent 84.9% |
| Immigrants | Uruguay | 84.0 /100 | #127 | Excellent 84.9% |
| Australians | 83.6 /100 | #128 | Excellent 84.9% |
| Immigrants | Russia | 81.6 /100 | #129 | Excellent 84.9% |
| Northern Europeans | 81.3 /100 | #130 | Excellent 84.9% |
| Iranians | 78.1 /100 | #131 | Good 84.8% |
| Romanians | 77.7 /100 | #132 | Good 84.8% |
| Asians | 77.7 /100 | #133 | Good 84.8% |
| Syrians | 76.5 /100 | #134 | Good 84.8% |
| Immigrants | Hungary | 76.4 /100 | #135 | Good 84.8% |