Immigrants from Bolivia vs Australian In Labor Force | Age 25-29
COMPARE
Immigrants from Bolivia
Australian
In Labor Force | Age 25-29
In Labor Force | Age 25-29 Comparison
Immigrants from Bolivia
Australians
86.1%
IN LABOR FORCE | AGE 25-29
100.0/ 100
METRIC RATING
16th/ 347
METRIC RANK
84.9%
IN LABOR FORCE | AGE 25-29
83.6/ 100
METRIC RATING
128th/ 347
METRIC RANK
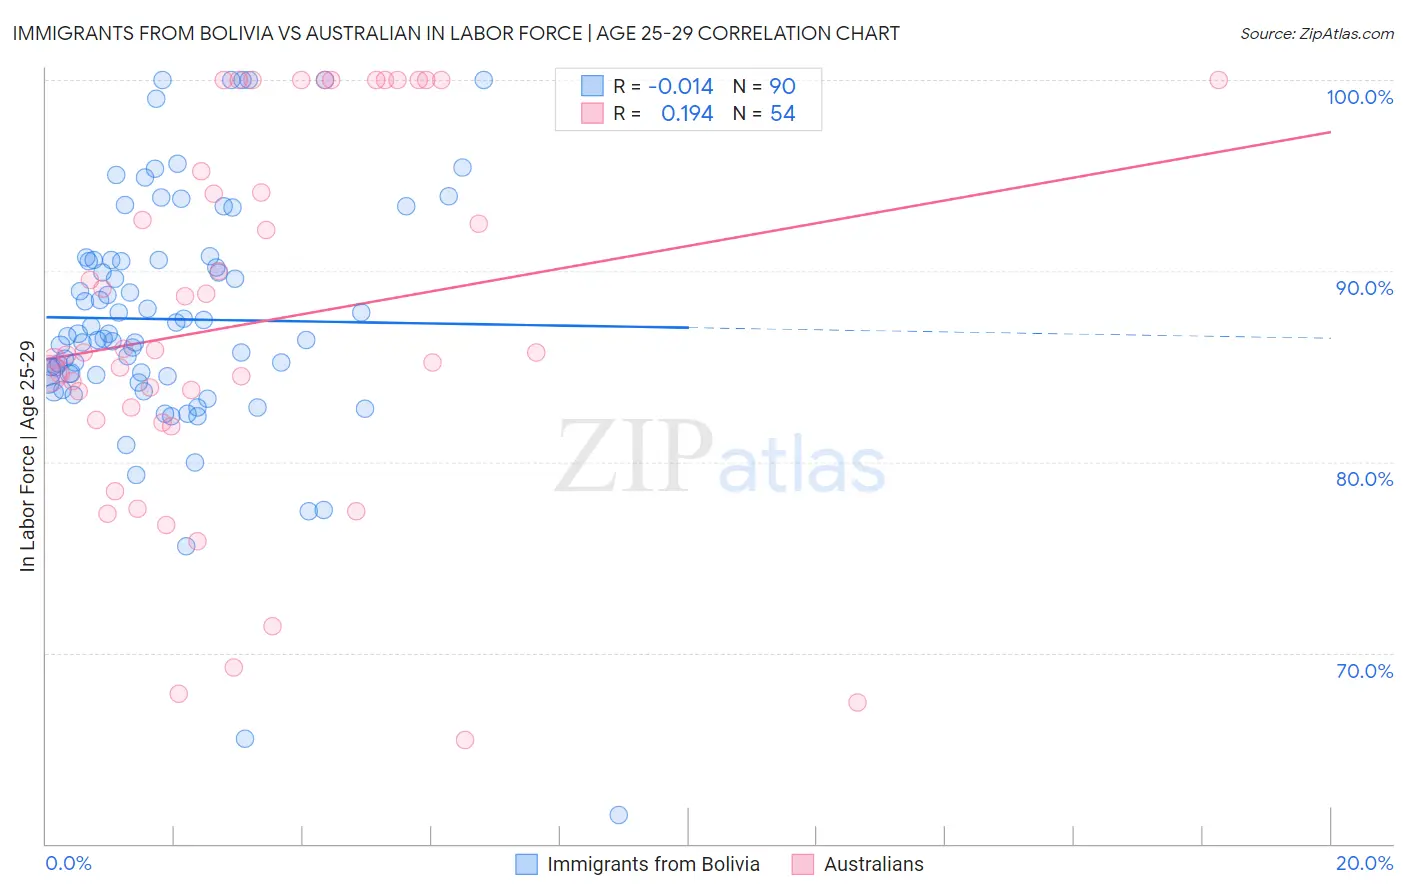
Immigrants from Bolivia vs Australian In Labor Force | Age 25-29 Correlation Chart
The statistical analysis conducted on geographies consisting of 158,717,059 people shows no correlation between the proportion of Immigrants from Bolivia and labor force participation rate among population between the ages 25 and 29 in the United States with a correlation coefficient (R) of -0.014 and weighted average of 86.1%. Similarly, the statistical analysis conducted on geographies consisting of 224,101,072 people shows a poor positive correlation between the proportion of Australians and labor force participation rate among population between the ages 25 and 29 in the United States with a correlation coefficient (R) of 0.194 and weighted average of 84.9%, a difference of 1.4%.
In Labor Force | Age 25-29 Correlation Summary
| Measurement | Immigrants from Bolivia | Australian |
| Minimum | 61.5% | 65.4% |
| Maximum | 100.0% | 100.0% |
| Range | 38.5% | 34.6% |
| Mean | 87.5% | 87.3% |
| Median | 86.7% | 85.7% |
| Interquartile 25% (IQ1) | 84.5% | 82.2% |
| Interquartile 75% (IQ3) | 90.6% | 95.2% |
| Interquartile Range (IQR) | 6.1% | 13.0% |
| Standard Deviation (Sample) | 6.5% | 9.7% |
| Standard Deviation (Population) | 6.5% | 9.6% |
Similar Demographics by In Labor Force | Age 25-29
Demographics Similar to Immigrants from Bolivia by In Labor Force | Age 25-29
In terms of in labor force | age 25-29, the demographic groups most similar to Immigrants from Bolivia are Latvian (86.1%, a difference of 0.010%), Bolivian (86.1%, a difference of 0.010%), Norwegian (86.1%, a difference of 0.040%), Bermudan (86.0%, a difference of 0.040%), and Immigrants from Lithuania (86.1%, a difference of 0.050%).
| Demographics | Rating | Rank | In Labor Force | Age 25-29 |
| Ethiopians | 100.0 /100 | #9 | Exceptional 86.2% |
| Liberians | 100.0 /100 | #10 | Exceptional 86.1% |
| Immigrants | Ethiopia | 100.0 /100 | #11 | Exceptional 86.1% |
| Immigrants | Lithuania | 100.0 /100 | #12 | Exceptional 86.1% |
| Norwegians | 100.0 /100 | #13 | Exceptional 86.1% |
| Latvians | 100.0 /100 | #14 | Exceptional 86.1% |
| Bolivians | 100.0 /100 | #15 | Exceptional 86.1% |
| Immigrants | Bolivia | 100.0 /100 | #16 | Exceptional 86.1% |
| Bermudans | 100.0 /100 | #17 | Exceptional 86.0% |
| Bulgarians | 100.0 /100 | #18 | Exceptional 86.0% |
| Cape Verdeans | 100.0 /100 | #19 | Exceptional 86.0% |
| Immigrants | Ireland | 100.0 /100 | #20 | Exceptional 86.0% |
| Maltese | 100.0 /100 | #21 | Exceptional 86.0% |
| Cambodians | 100.0 /100 | #22 | Exceptional 86.0% |
| Immigrants | Uganda | 100.0 /100 | #23 | Exceptional 86.0% |
Demographics Similar to Australians by In Labor Force | Age 25-29
In terms of in labor force | age 25-29, the demographic groups most similar to Australians are Uruguayan (84.9%, a difference of 0.010%), Immigrants from Singapore (84.9%, a difference of 0.010%), Immigrants from Uruguay (84.9%, a difference of 0.010%), Scandinavian (84.9%, a difference of 0.020%), and Dutch (84.9%, a difference of 0.020%).
| Demographics | Rating | Rank | In Labor Force | Age 25-29 |
| Immigrants | Chile | 85.6 /100 | #121 | Excellent 84.9% |
| Scandinavians | 85.1 /100 | #122 | Excellent 84.9% |
| Dutch | 84.9 /100 | #123 | Excellent 84.9% |
| Immigrants | Iran | 84.8 /100 | #124 | Excellent 84.9% |
| Uruguayans | 84.7 /100 | #125 | Excellent 84.9% |
| Immigrants | Singapore | 84.4 /100 | #126 | Excellent 84.9% |
| Immigrants | Uruguay | 84.0 /100 | #127 | Excellent 84.9% |
| Australians | 83.6 /100 | #128 | Excellent 84.9% |
| Immigrants | Russia | 81.6 /100 | #129 | Excellent 84.9% |
| Northern Europeans | 81.3 /100 | #130 | Excellent 84.9% |
| Iranians | 78.1 /100 | #131 | Good 84.8% |
| Romanians | 77.7 /100 | #132 | Good 84.8% |
| Asians | 77.7 /100 | #133 | Good 84.8% |
| Syrians | 76.5 /100 | #134 | Good 84.8% |
| Immigrants | Hungary | 76.4 /100 | #135 | Good 84.8% |