Guatemalan vs Bhutanese In Labor Force | Age 30-34
COMPARE
Guatemalan
Bhutanese
In Labor Force | Age 30-34
In Labor Force | Age 30-34 Comparison
Guatemalans
Bhutanese
83.7%
IN LABOR FORCE | AGE 30-34
0.2/ 100
METRIC RATING
264th/ 347
METRIC RANK
85.0%
IN LABOR FORCE | AGE 30-34
87.5/ 100
METRIC RATING
139th/ 347
METRIC RANK
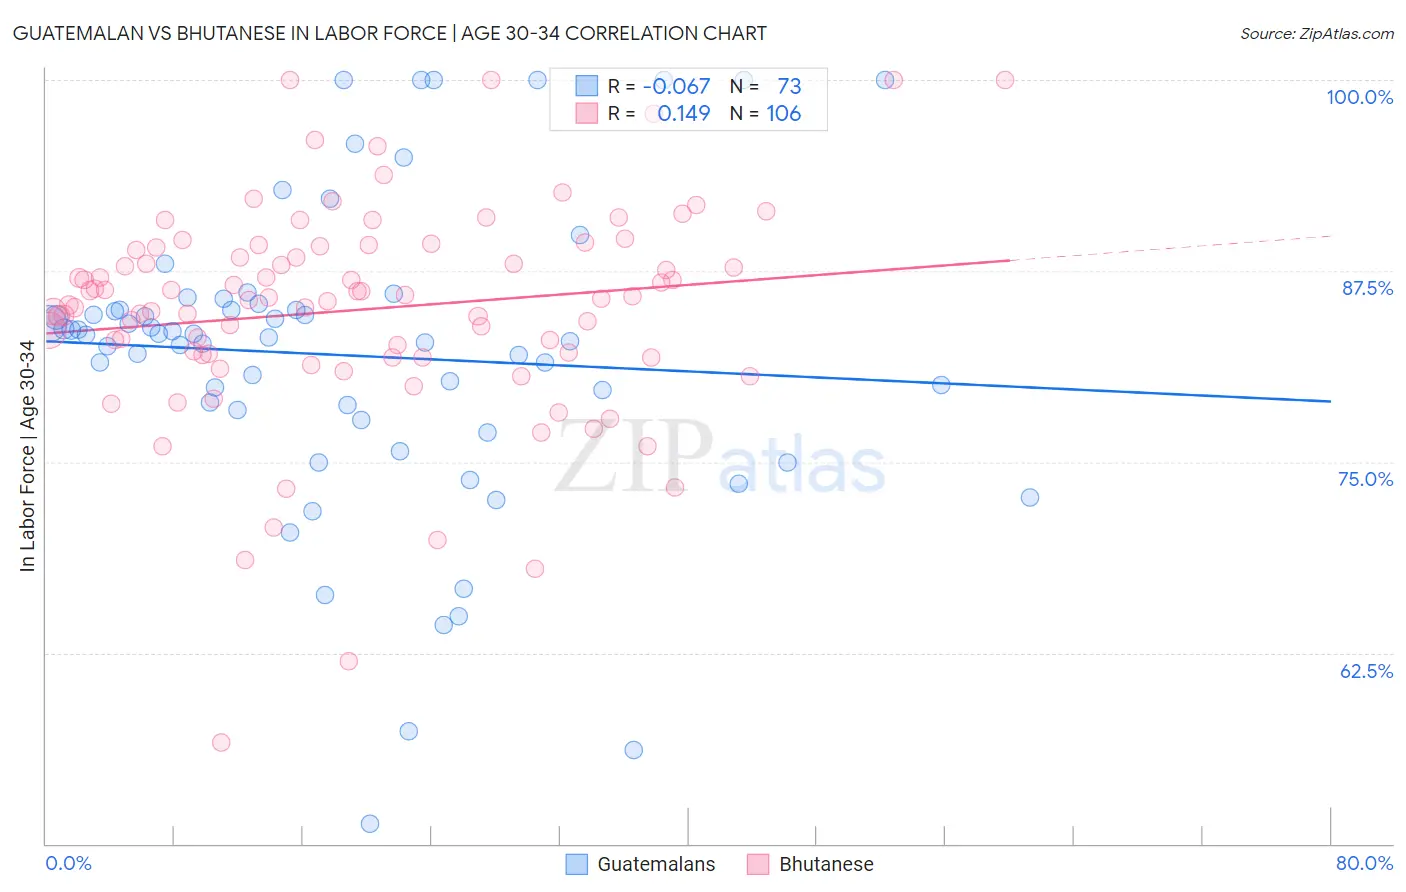
Guatemalan vs Bhutanese In Labor Force | Age 30-34 Correlation Chart
The statistical analysis conducted on geographies consisting of 409,343,950 people shows a slight negative correlation between the proportion of Guatemalans and labor force participation rate among population between the ages 30 and 34 in the United States with a correlation coefficient (R) of -0.067 and weighted average of 83.7%. Similarly, the statistical analysis conducted on geographies consisting of 455,199,053 people shows a poor positive correlation between the proportion of Bhutanese and labor force participation rate among population between the ages 30 and 34 in the United States with a correlation coefficient (R) of 0.149 and weighted average of 85.0%, a difference of 1.5%.
In Labor Force | Age 30-34 Correlation Summary
| Measurement | Guatemalan | Bhutanese |
| Minimum | 51.3% | 56.7% |
| Maximum | 100.0% | 100.0% |
| Range | 48.7% | 43.3% |
| Mean | 82.0% | 85.0% |
| Median | 83.3% | 85.7% |
| Interquartile 25% (IQ1) | 78.0% | 82.0% |
| Interquartile 75% (IQ3) | 85.1% | 89.0% |
| Interquartile Range (IQR) | 7.1% | 7.0% |
| Standard Deviation (Sample) | 10.0% | 7.2% |
| Standard Deviation (Population) | 9.9% | 7.1% |
Similar Demographics by In Labor Force | Age 30-34
Demographics Similar to Guatemalans by In Labor Force | Age 30-34
In terms of in labor force | age 30-34, the demographic groups most similar to Guatemalans are Immigrants from Honduras (83.7%, a difference of 0.030%), Dominican (83.8%, a difference of 0.050%), Immigrants from Guyana (83.8%, a difference of 0.050%), Immigrants from Guatemala (83.7%, a difference of 0.050%), and Guyanese (83.8%, a difference of 0.070%).
| Demographics | Rating | Rank | In Labor Force | Age 30-34 |
| Iraqis | 0.3 /100 | #257 | Tragic 83.8% |
| Hondurans | 0.3 /100 | #258 | Tragic 83.8% |
| Scotch-Irish | 0.3 /100 | #259 | Tragic 83.8% |
| Immigrants | Dominican Republic | 0.3 /100 | #260 | Tragic 83.8% |
| Guyanese | 0.3 /100 | #261 | Tragic 83.8% |
| Dominicans | 0.2 /100 | #262 | Tragic 83.8% |
| Immigrants | Guyana | 0.2 /100 | #263 | Tragic 83.8% |
| Guatemalans | 0.2 /100 | #264 | Tragic 83.7% |
| Immigrants | Honduras | 0.1 /100 | #265 | Tragic 83.7% |
| Immigrants | Guatemala | 0.1 /100 | #266 | Tragic 83.7% |
| Spaniards | 0.1 /100 | #267 | Tragic 83.6% |
| Immigrants | Bangladesh | 0.1 /100 | #268 | Tragic 83.6% |
| Vietnamese | 0.1 /100 | #269 | Tragic 83.6% |
| Spanish Americans | 0.0 /100 | #270 | Tragic 83.5% |
| Spanish | 0.0 /100 | #271 | Tragic 83.5% |
Demographics Similar to Bhutanese by In Labor Force | Age 30-34
In terms of in labor force | age 30-34, the demographic groups most similar to Bhutanese are South African (85.0%, a difference of 0.010%), Sri Lankan (85.0%, a difference of 0.010%), Immigrants from Asia (85.0%, a difference of 0.020%), Jordanian (85.0%, a difference of 0.020%), and Immigrants from Vietnam (85.0%, a difference of 0.020%).
| Demographics | Rating | Rank | In Labor Force | Age 30-34 |
| Immigrants | Israel | 89.5 /100 | #132 | Excellent 85.0% |
| New Zealanders | 89.5 /100 | #133 | Excellent 85.0% |
| Immigrants | Chile | 89.2 /100 | #134 | Excellent 85.0% |
| Immigrants | Asia | 88.9 /100 | #135 | Excellent 85.0% |
| Jordanians | 88.6 /100 | #136 | Excellent 85.0% |
| South Africans | 88.0 /100 | #137 | Excellent 85.0% |
| Sri Lankans | 87.8 /100 | #138 | Excellent 85.0% |
| Bhutanese | 87.5 /100 | #139 | Excellent 85.0% |
| Immigrants | Vietnam | 86.5 /100 | #140 | Excellent 85.0% |
| Chileans | 85.3 /100 | #141 | Excellent 84.9% |
| Immigrants | Indonesia | 84.3 /100 | #142 | Excellent 84.9% |
| Colombians | 82.2 /100 | #143 | Excellent 84.9% |
| Uruguayans | 78.5 /100 | #144 | Good 84.9% |
| Palestinians | 77.7 /100 | #145 | Good 84.9% |
| Immigrants | Saudi Arabia | 76.6 /100 | #146 | Good 84.9% |