Guamanian/Chamorro vs Ute In Labor Force | Age 20-24
COMPARE
Guamanian/Chamorro
Ute
In Labor Force | Age 20-24
In Labor Force | Age 20-24 Comparison
Guamanians/Chamorros
Ute
76.7%
IN LABOR FORCE | AGE 20-24
99.8/ 100
METRIC RATING
72nd/ 347
METRIC RANK
73.8%
IN LABOR FORCE | AGE 20-24
1.0/ 100
METRIC RATING
254th/ 347
METRIC RANK
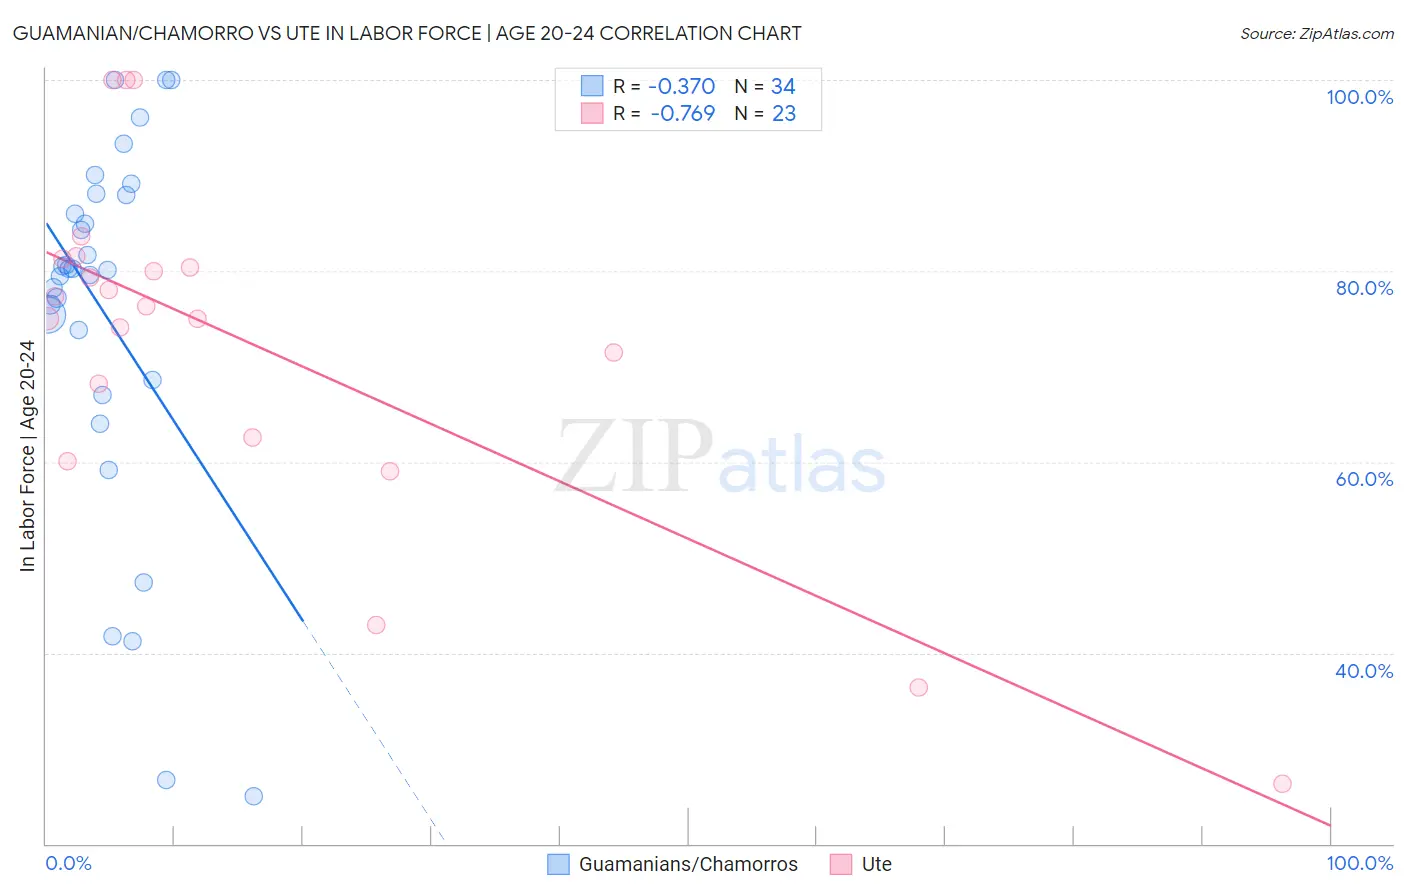
Guamanian/Chamorro vs Ute In Labor Force | Age 20-24 Correlation Chart
The statistical analysis conducted on geographies consisting of 221,886,711 people shows a mild negative correlation between the proportion of Guamanians/Chamorros and labor force participation rate among population between the ages 20 and 24 in the United States with a correlation coefficient (R) of -0.370 and weighted average of 76.7%. Similarly, the statistical analysis conducted on geographies consisting of 55,663,255 people shows a strong negative correlation between the proportion of Ute and labor force participation rate among population between the ages 20 and 24 in the United States with a correlation coefficient (R) of -0.769 and weighted average of 73.8%, a difference of 4.0%.
In Labor Force | Age 20-24 Correlation Summary
| Measurement | Guamanian/Chamorro | Ute |
| Minimum | 25.0% | 26.3% |
| Maximum | 100.0% | 100.0% |
| Range | 75.0% | 73.7% |
| Mean | 75.4% | 72.5% |
| Median | 80.2% | 76.4% |
| Interquartile 25% (IQ1) | 68.6% | 62.5% |
| Interquartile 75% (IQ3) | 88.0% | 81.3% |
| Interquartile Range (IQR) | 19.4% | 18.8% |
| Standard Deviation (Sample) | 19.3% | 18.6% |
| Standard Deviation (Population) | 19.0% | 18.1% |
Similar Demographics by In Labor Force | Age 20-24
Demographics Similar to Guamanians/Chamorros by In Labor Force | Age 20-24
In terms of in labor force | age 20-24, the demographic groups most similar to Guamanians/Chamorros are Northern European (76.8%, a difference of 0.030%), British (76.7%, a difference of 0.050%), Ottawa (76.8%, a difference of 0.10%), Immigrants from Sudan (76.8%, a difference of 0.11%), and Cree (76.6%, a difference of 0.12%).
| Demographics | Rating | Rank | In Labor Force | Age 20-24 |
| Crow | 99.9 /100 | #65 | Exceptional 76.9% |
| Icelanders | 99.9 /100 | #66 | Exceptional 76.9% |
| Slavs | 99.9 /100 | #67 | Exceptional 76.9% |
| French American Indians | 99.8 /100 | #68 | Exceptional 76.8% |
| Immigrants | Sudan | 99.8 /100 | #69 | Exceptional 76.8% |
| Ottawa | 99.8 /100 | #70 | Exceptional 76.8% |
| Northern Europeans | 99.8 /100 | #71 | Exceptional 76.8% |
| Guamanians/Chamorros | 99.8 /100 | #72 | Exceptional 76.7% |
| British | 99.8 /100 | #73 | Exceptional 76.7% |
| Cree | 99.7 /100 | #74 | Exceptional 76.6% |
| Immigrants | Middle Africa | 99.7 /100 | #75 | Exceptional 76.6% |
| Immigrants | Moldova | 99.6 /100 | #76 | Exceptional 76.6% |
| Immigrants | Cameroon | 99.6 /100 | #77 | Exceptional 76.6% |
| Canadians | 99.6 /100 | #78 | Exceptional 76.6% |
| Immigrants | Zaire | 99.6 /100 | #79 | Exceptional 76.6% |
Demographics Similar to Ute by In Labor Force | Age 20-24
In terms of in labor force | age 20-24, the demographic groups most similar to Ute are Arapaho (73.8%, a difference of 0.0%), Immigrants from Pakistan (73.8%, a difference of 0.020%), Immigrants from Kazakhstan (73.8%, a difference of 0.050%), Immigrants from Egypt (73.8%, a difference of 0.070%), and Spanish American Indian (73.7%, a difference of 0.070%).
| Demographics | Rating | Rank | In Labor Force | Age 20-24 |
| Colville | 1.5 /100 | #247 | Tragic 73.9% |
| Immigrants | Saudi Arabia | 1.5 /100 | #248 | Tragic 73.9% |
| Blacks/African Americans | 1.3 /100 | #249 | Tragic 73.9% |
| Immigrants | Belgium | 1.3 /100 | #250 | Tragic 73.9% |
| Immigrants | Egypt | 1.2 /100 | #251 | Tragic 73.8% |
| Immigrants | Kazakhstan | 1.1 /100 | #252 | Tragic 73.8% |
| Arapaho | 1.0 /100 | #253 | Tragic 73.8% |
| Ute | 1.0 /100 | #254 | Tragic 73.8% |
| Immigrants | Pakistan | 0.9 /100 | #255 | Tragic 73.8% |
| Spanish American Indians | 0.8 /100 | #256 | Tragic 73.7% |
| Paraguayans | 0.8 /100 | #257 | Tragic 73.7% |
| Egyptians | 0.7 /100 | #258 | Tragic 73.7% |
| Dutch West Indians | 0.7 /100 | #259 | Tragic 73.7% |
| Immigrants | Turkey | 0.7 /100 | #260 | Tragic 73.7% |
| Houma | 0.6 /100 | #261 | Tragic 73.7% |