Guamanian/Chamorro vs Guyanese In Labor Force | Age 20-24
COMPARE
Guamanian/Chamorro
Guyanese
In Labor Force | Age 20-24
In Labor Force | Age 20-24 Comparison
Guamanians/Chamorros
Guyanese
76.7%
IN LABOR FORCE | AGE 20-24
99.8/ 100
METRIC RATING
72nd/ 347
METRIC RANK
69.2%
IN LABOR FORCE | AGE 20-24
0.0/ 100
METRIC RATING
337th/ 347
METRIC RANK
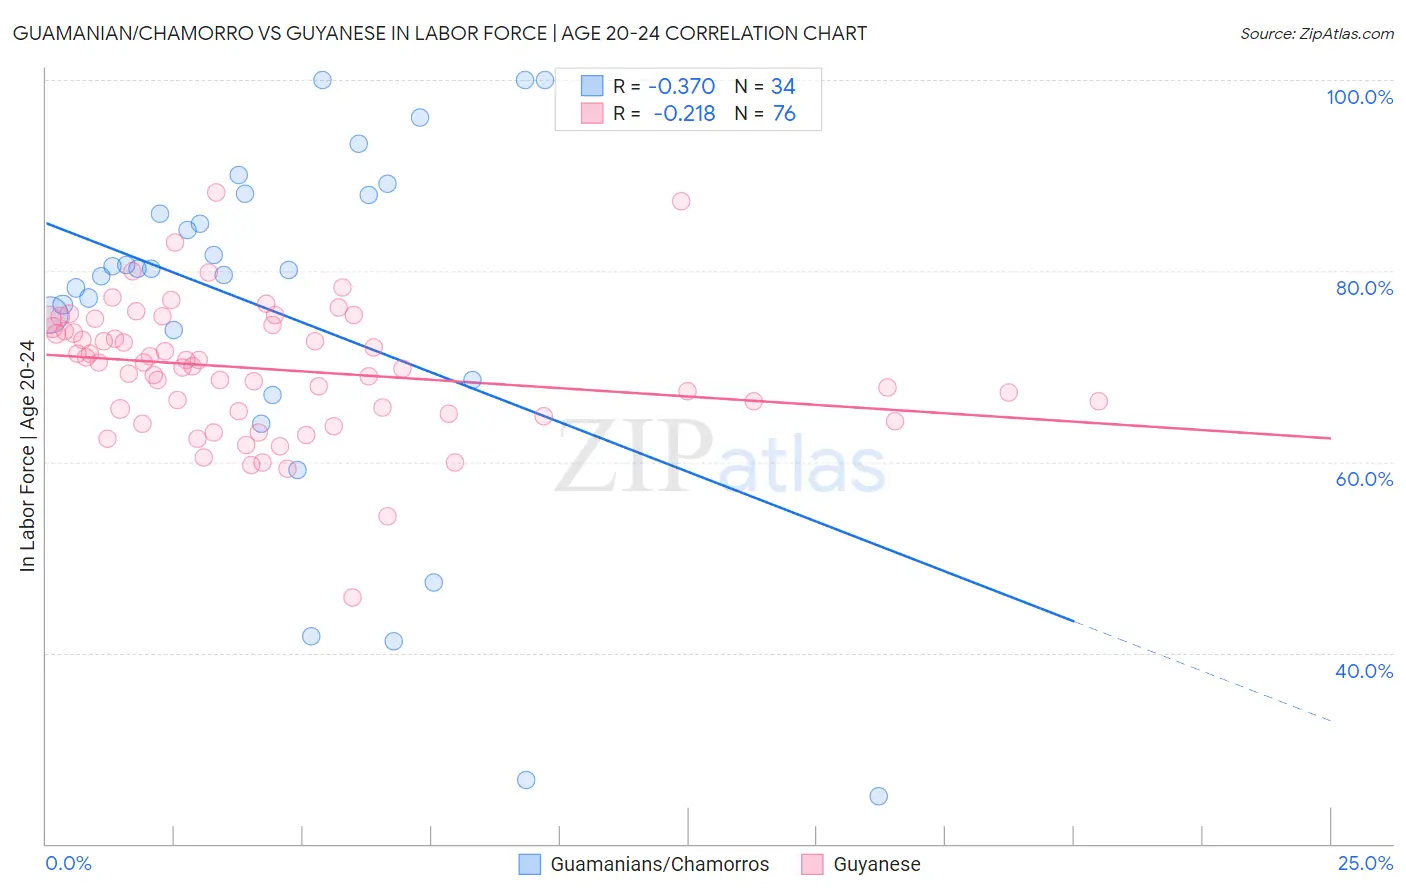
Guamanian/Chamorro vs Guyanese In Labor Force | Age 20-24 Correlation Chart
The statistical analysis conducted on geographies consisting of 221,886,711 people shows a mild negative correlation between the proportion of Guamanians/Chamorros and labor force participation rate among population between the ages 20 and 24 in the United States with a correlation coefficient (R) of -0.370 and weighted average of 76.7%. Similarly, the statistical analysis conducted on geographies consisting of 176,880,336 people shows a weak negative correlation between the proportion of Guyanese and labor force participation rate among population between the ages 20 and 24 in the United States with a correlation coefficient (R) of -0.218 and weighted average of 69.2%, a difference of 10.9%.
In Labor Force | Age 20-24 Correlation Summary
| Measurement | Guamanian/Chamorro | Guyanese |
| Minimum | 25.0% | 45.8% |
| Maximum | 100.0% | 88.3% |
| Range | 75.0% | 42.5% |
| Mean | 75.4% | 69.7% |
| Median | 80.2% | 70.2% |
| Interquartile 25% (IQ1) | 68.6% | 65.2% |
| Interquartile 75% (IQ3) | 88.0% | 74.2% |
| Interquartile Range (IQR) | 19.4% | 9.1% |
| Standard Deviation (Sample) | 19.3% | 6.9% |
| Standard Deviation (Population) | 19.0% | 6.9% |
Similar Demographics by In Labor Force | Age 20-24
Demographics Similar to Guamanians/Chamorros by In Labor Force | Age 20-24
In terms of in labor force | age 20-24, the demographic groups most similar to Guamanians/Chamorros are Northern European (76.8%, a difference of 0.030%), British (76.7%, a difference of 0.050%), Ottawa (76.8%, a difference of 0.10%), Immigrants from Sudan (76.8%, a difference of 0.11%), and Cree (76.6%, a difference of 0.12%).
| Demographics | Rating | Rank | In Labor Force | Age 20-24 |
| Crow | 99.9 /100 | #65 | Exceptional 76.9% |
| Icelanders | 99.9 /100 | #66 | Exceptional 76.9% |
| Slavs | 99.9 /100 | #67 | Exceptional 76.9% |
| French American Indians | 99.8 /100 | #68 | Exceptional 76.8% |
| Immigrants | Sudan | 99.8 /100 | #69 | Exceptional 76.8% |
| Ottawa | 99.8 /100 | #70 | Exceptional 76.8% |
| Northern Europeans | 99.8 /100 | #71 | Exceptional 76.8% |
| Guamanians/Chamorros | 99.8 /100 | #72 | Exceptional 76.7% |
| British | 99.8 /100 | #73 | Exceptional 76.7% |
| Cree | 99.7 /100 | #74 | Exceptional 76.6% |
| Immigrants | Middle Africa | 99.7 /100 | #75 | Exceptional 76.6% |
| Immigrants | Moldova | 99.6 /100 | #76 | Exceptional 76.6% |
| Immigrants | Cameroon | 99.6 /100 | #77 | Exceptional 76.6% |
| Canadians | 99.6 /100 | #78 | Exceptional 76.6% |
| Immigrants | Zaire | 99.6 /100 | #79 | Exceptional 76.6% |
Demographics Similar to Guyanese by In Labor Force | Age 20-24
In terms of in labor force | age 20-24, the demographic groups most similar to Guyanese are Immigrants from Guyana (69.3%, a difference of 0.13%), Pima (69.0%, a difference of 0.26%), Immigrants from Yemen (68.9%, a difference of 0.39%), Menominee (68.7%, a difference of 0.70%), and Immigrants from Barbados (69.7%, a difference of 0.79%).
| Demographics | Rating | Rank | In Labor Force | Age 20-24 |
| Vietnamese | 0.0 /100 | #330 | Tragic 70.6% |
| Immigrants | Bangladesh | 0.0 /100 | #331 | Tragic 70.6% |
| Immigrants | Uzbekistan | 0.0 /100 | #332 | Tragic 70.4% |
| Yuman | 0.0 /100 | #333 | Tragic 70.3% |
| British West Indians | 0.0 /100 | #334 | Tragic 70.0% |
| Immigrants | Barbados | 0.0 /100 | #335 | Tragic 69.7% |
| Immigrants | Guyana | 0.0 /100 | #336 | Tragic 69.3% |
| Guyanese | 0.0 /100 | #337 | Tragic 69.2% |
| Pima | 0.0 /100 | #338 | Tragic 69.0% |
| Immigrants | Yemen | 0.0 /100 | #339 | Tragic 68.9% |
| Menominee | 0.0 /100 | #340 | Tragic 68.7% |
| Tohono O'odham | 0.0 /100 | #341 | Tragic 68.6% |
| Immigrants | St. Vincent and the Grenadines | 0.0 /100 | #342 | Tragic 68.4% |
| Puerto Ricans | 0.0 /100 | #343 | Tragic 68.3% |
| Immigrants | Grenada | 0.0 /100 | #344 | Tragic 67.2% |