Welsh vs Cape Verdean In Labor Force | Age 20-24

COMPARE

Welsh
Race
Ancestry
AfghanAfricanAlaska NativeAlaskan AthabascanAlbanianAleutAlsatianAmericanApacheArabArapahoArgentineanArmenianAssyrian/Chaldean/SyriacAustralianAustrianBahamianBangladeshiBarbadianBasqueBelgianBelizeanBermudanBhutaneseBlackfeetBolivianBrazilianBritishBritish West IndianBulgarianBurmeseCajunCambodianCanadianCarpatho RusynCelticCentral AmericanCentral American IndianCherokeeCheyenneChickasawChileanChineseChippewaChoctawColombianColvilleComancheCosta RicanCreeCreekCroatianCrowCubanCypriotCzechCzechoslovakianDanishDelawareDominicanDutchDutch West IndianEastern EuropeanEcuadorianEgyptianEnglishEstonianEthiopianEuropeanFijianFilipinoFinnishFrenchFrench American IndianFrench CanadianGermanGerman RussianGhanaianGreekGuamanian/ChamorroGuatemalanGuyaneseHaitianHmongHonduranHopiHoumaHungarianIcelanderIndian (Asian)IndonesianInupiatIranianIraqiIrishIroquoisIsraeliItalianJamaicanJapaneseJordanianKenyanKiowaKoreanLaotianLatvianLebaneseLiberianLithuanianLumbeeLuxembourgerMacedonianMalaysianMalteseMarshalleseMenomineeMexicanMexican American IndianMongolianMoroccanNative HawaiianNavajoNepaleseNew ZealanderNicaraguanNigerianNorthern EuropeanNorwegianOkinawanOsageOttawaPaiutePakistaniPalestinianPanamanianParaguayanPennsylvania GermanPeruvianPimaPolishPortuguesePotawatomiPuebloPuerto RicanPuget Sound SalishRomanianRussianSalvadoranSamoanScandinavianScotch-IrishScottishSeminoleSenegaleseSerbianShoshoneSierra LeoneanSiouxSlavicSlovakSloveneSomaliSouth AfricanSouth AmericanSouth American IndianSoviet UnionSpaniardSpanishSpanish AmericanSpanish American IndianSri LankanSubsaharan AfricanSudaneseSwedishSwissSyrianTaiwaneseThaiTlingit-HaidaTohono O'OdhamTonganTrinidadian and TobagonianTsimshianTurkishU.S. Virgin IslanderUgandanUkrainianUruguayanUteVenezuelanVietnameseWelshWest IndianYakamaYaquiYugoslavianYumanYup'ikZimbabwean
Immigration
NonimmigrantsImmigrantsAfghanistanAfricaAlbaniaArgentinaArmeniaAsiaAustraliaAustriaBahamasBangladeshBarbadosBelarusBelgiumBelizeBoliviaBosnia and HerzegovinaBrazilBulgariaBurma/MyanmarCabo VerdeCambodiaCameroonCanadaCaribbeanCentral AmericaChileChinaColombiaCongoCosta RicaCroatiaCubaCzechoslovakiaDenmarkDominicaDominican RepublicEastern AfricaEastern AsiaEastern EuropeEcuadorEgyptEl SalvadorEnglandEritreaEthiopiaEuropeFijiFranceGermanyGhanaGreeceGrenadaGuatemalaGuyanaHaitiHondurasHong KongHungaryIndiaIndonesiaIranIraqIrelandIsraelItalyJamaicaJapanJordanKazakhstanKenyaKoreaKuwaitLaosLatin AmericaLatviaLebanonLiberiaLithuaniaMalaysiaMexicoMicronesiaMiddle AfricaMoldovaMoroccoNepalNetherlandsNicaraguaNigeriaNorth AmericaNorth MacedoniaNorthern AfricaNorthern EuropeNorwayOceaniaPakistanPanamaPeruPhilippinesPolandPortugalRomaniaRussiaSaudi ArabiaScotlandSenegalSerbiaSierra LeoneSingaporeSomaliaSouth AfricaSouth AmericaSouth Central AsiaSouth Eastern AsiaSouthern EuropeSpainSri LankaSt. Vincent and the GrenadinesSudanSwedenSwitzerlandSyriaTaiwanThailandTrinidad and TobagoTurkeyUgandaUkraineUruguayUzbekistanVenezuelaVietnamWest IndiesWestern AfricaWestern AsiaWestern EuropeYemenZaireZimbabweAzores
Cape Verdean
Race
Ancestry
AfghanAfricanAlaska NativeAlaskan AthabascanAlbanianAleutAlsatianAmericanApacheArabArapahoArgentineanArmenianAssyrian/Chaldean/SyriacAustralianAustrianBahamianBangladeshiBarbadianBasqueBelgianBelizeanBermudanBhutaneseBlackfeetBolivianBrazilianBritishBritish West IndianBulgarianBurmeseCajunCambodianCanadianCape VerdeanCarpatho RusynCelticCentral AmericanCentral American IndianCherokeeCheyenneChickasawChileanChineseChippewaChoctawColombianColvilleComancheCosta RicanCreeCreekCroatianCrowCubanCypriotCzechCzechoslovakianDanishDelawareDominicanDutchDutch West IndianEastern EuropeanEcuadorianEgyptianEnglishEstonianEthiopianEuropeanFijianFilipinoFinnishFrenchFrench American IndianFrench CanadianGermanGerman RussianGhanaianGreekGuamanian/ChamorroGuatemalanGuyaneseHaitianHmongHonduranHopiHoumaHungarianIcelanderIndian (Asian)IndonesianInupiatIranianIraqiIrishIroquoisIsraeliItalianJamaicanJapaneseJordanianKenyanKiowaKoreanLaotianLatvianLebaneseLiberianLithuanianLumbeeLuxembourgerMacedonianMalaysianMalteseMarshalleseMenomineeMexicanMexican American IndianMongolianMoroccanNative HawaiianNavajoNepaleseNew ZealanderNicaraguanNigerianNorthern EuropeanNorwegianOkinawanOsageOttawaPaiutePakistaniPalestinianPanamanianParaguayanPennsylvania GermanPeruvianPimaPolishPortuguesePotawatomiPuebloPuerto RicanPuget Sound SalishRomanianRussianSalvadoranSamoanScandinavianScotch-IrishScottishSeminoleSenegaleseSerbianShoshoneSierra LeoneanSiouxSlavicSlovakSloveneSomaliSouth AfricanSouth AmericanSouth American IndianSoviet UnionSpaniardSpanishSpanish AmericanSpanish American IndianSri LankanSubsaharan AfricanSudaneseSwedishSwissSyrianTaiwaneseThaiTlingit-HaidaTohono O'OdhamTonganTrinidadian and TobagonianTsimshianTurkishU.S. Virgin IslanderUgandanUkrainianUruguayanUteVenezuelanVietnameseWest IndianYakamaYaquiYugoslavianYumanYup'ikZimbabwean
Immigration
NonimmigrantsImmigrantsAfghanistanAfricaAlbaniaArgentinaArmeniaAsiaAustraliaAustriaBahamasBangladeshBarbadosBelarusBelgiumBelizeBoliviaBosnia and HerzegovinaBrazilBulgariaBurma/MyanmarCabo VerdeCambodiaCameroonCanadaCaribbeanCentral AmericaChileChinaColombiaCongoCosta RicaCroatiaCubaCzechoslovakiaDenmarkDominicaDominican RepublicEastern AfricaEastern AsiaEastern EuropeEcuadorEgyptEl SalvadorEnglandEritreaEthiopiaEuropeFijiFranceGermanyGhanaGreeceGrenadaGuatemalaGuyanaHaitiHondurasHong KongHungaryIndiaIndonesiaIranIraqIrelandIsraelItalyJamaicaJapanJordanKazakhstanKenyaKoreaKuwaitLaosLatin AmericaLatviaLebanonLiberiaLithuaniaMalaysiaMexicoMicronesiaMiddle AfricaMoldovaMoroccoNepalNetherlandsNicaraguaNigeriaNorth AmericaNorth MacedoniaNorthern AfricaNorthern EuropeNorwayOceaniaPakistanPanamaPeruPhilippinesPolandPortugalRomaniaRussiaSaudi ArabiaScotlandSenegalSerbiaSierra LeoneSingaporeSomaliaSouth AfricaSouth AmericaSouth Central AsiaSouth Eastern AsiaSouthern EuropeSpainSri LankaSt. Vincent and the GrenadinesSudanSwedenSwitzerlandSyriaTaiwanThailandTrinidad and TobagoTurkeyUgandaUkraineUruguayUzbekistanVenezuelaVietnamWest IndiesWestern AfricaWestern AsiaWestern EuropeYemenZaireZimbabweAzores
In Labor Force | Age 20-24
Income
Poverty
Unemployment
Labor Participation
Family Structure
Vehicle Availability
Education Level
Disability

In Labor Force | Age 20-24 Comparison

Welsh

Cape Verdeans

Exceptional
Exceptional
77.5%
IN LABOR FORCE | AGE 20-24
100.0/ 100
METRIC RATING
36th/ 347
METRIC RANK
78.3%
IN LABOR FORCE | AGE 20-24
100.0/ 100
METRIC RATING
17th/ 347
METRIC RANK

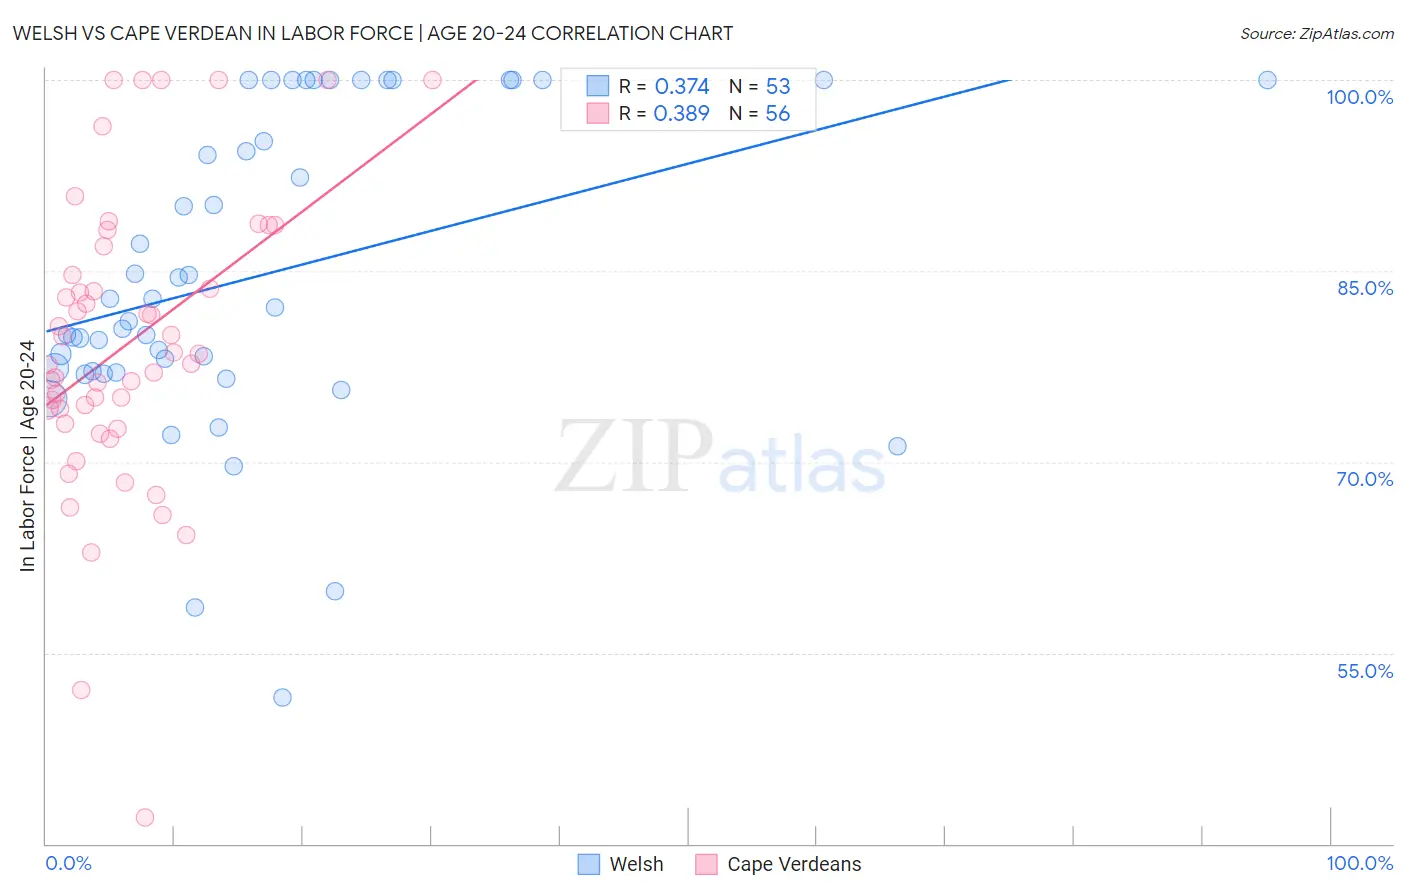
Welsh vs Cape Verdean In Labor Force | Age 20-24 Correlation Chart

The statistical analysis conducted on geographies consisting of 527,767,201 people shows a mild positive correlation between the proportion of Welsh and labor force participation rate among population between the ages 20 and 24 in the United States with a correlation coefficient (R) of 0.374 and weighted average of 77.5%. Similarly, the statistical analysis conducted on geographies consisting of 107,566,363 people shows a mild positive correlation between the proportion of Cape Verdeans and labor force participation rate among population between the ages 20 and 24 in the United States with a correlation coefficient (R) of 0.389 and weighted average of 78.3%, a difference of 1.1%.
Welsh vs Cape Verdean In Labor Force | Age 20-24

In Labor Force | Age 20-24 Correlation Summary

MeasurementWelshCape Verdean
Minimum51.4%42.1%
Maximum100.0%100.0%
Range48.6%57.9%
Mean84.7%79.3%
Median82.1%78.1%
Interquartile 25% (IQ1)77.1%73.6%
Interquartile 75% (IQ3)100.0%85.8%
Interquartile Range (IQR)22.9%12.2%
Standard Deviation (Sample)12.1%11.6%
Standard Deviation (Population)12.0%11.5%

Demographics Similar to Welsh and Cape Verdeans by In Labor Force | Age 20-24

In terms of in labor force | age 20-24, the demographic groups most similar to Welsh are Immigrants from Eastern Africa (77.5%, a difference of 0.020%), German Russian (77.5%, a difference of 0.030%), Immigrants from Ethiopia (77.5%, a difference of 0.040%), English (77.6%, a difference of 0.090%), and Polish (77.6%, a difference of 0.15%). Similarly, the demographic groups most similar to Cape Verdeans are Dutch (78.4%, a difference of 0.040%), Immigrants from Bosnia and Herzegovina (78.1%, a difference of 0.30%), Bangladeshi (78.1%, a difference of 0.30%), French Canadian (78.1%, a difference of 0.37%), and Puget Sound Salish (78.0%, a difference of 0.44%).
DemographicsRating | RankIn Labor Force | Age 20-24
Dutch
100.0
/100
|
#16
Exceptional
78.4%
Cape Verdeans
100.0
/100
|
#17
Exceptional
78.3%
Immigrants | Bosnia and Herzegovina
100.0
/100
|
#18
Exceptional
78.1%
Bangladeshis
100.0
/100
|
#19
Exceptional
78.1%
French Canadians
100.0
/100
|
#20
Exceptional
78.1%
Puget Sound Salish
100.0
/100
|
#21
Exceptional
78.0%
Pennsylvania Germans
100.0
/100
|
#22
Exceptional
78.0%
Yugoslavians
100.0
/100
|
#23
Exceptional
78.0%
Liberians
100.0
/100
|
#24
Exceptional
78.0%
Tlingit-Haida
100.0
/100
|
#25
Exceptional
77.9%
Tongans
100.0
/100
|
#26
Exceptional
77.9%
Immigrants | Micronesia
100.0
/100
|
#27
Exceptional
77.8%
Belgians
100.0
/100
|
#28
Exceptional
77.8%
Slovaks
100.0
/100
|
#29
Exceptional
77.7%
Swiss
100.0
/100
|
#30
Exceptional
77.7%
Poles
100.0
/100
|
#31
Exceptional
77.6%
English
100.0
/100
|
#32
Exceptional
77.6%
Immigrants | Ethiopia
100.0
/100
|
#33
Exceptional
77.5%
German Russians
100.0
/100
|
#34
Exceptional
77.5%
Immigrants | Eastern Africa
100.0
/100
|
#35
Exceptional
77.5%
Welsh
100.0
/100
|
#36
Exceptional
77.5%