Alsatian vs Cape Verdean In Labor Force | Age 20-24
COMPARE
Alsatian
Cape Verdean
In Labor Force | Age 20-24
In Labor Force | Age 20-24 Comparison
Alsatians
Cape Verdeans
74.8%
IN LABOR FORCE | AGE 20-24
27.1/ 100
METRIC RATING
193rd/ 347
METRIC RANK
78.3%
IN LABOR FORCE | AGE 20-24
100.0/ 100
METRIC RATING
17th/ 347
METRIC RANK
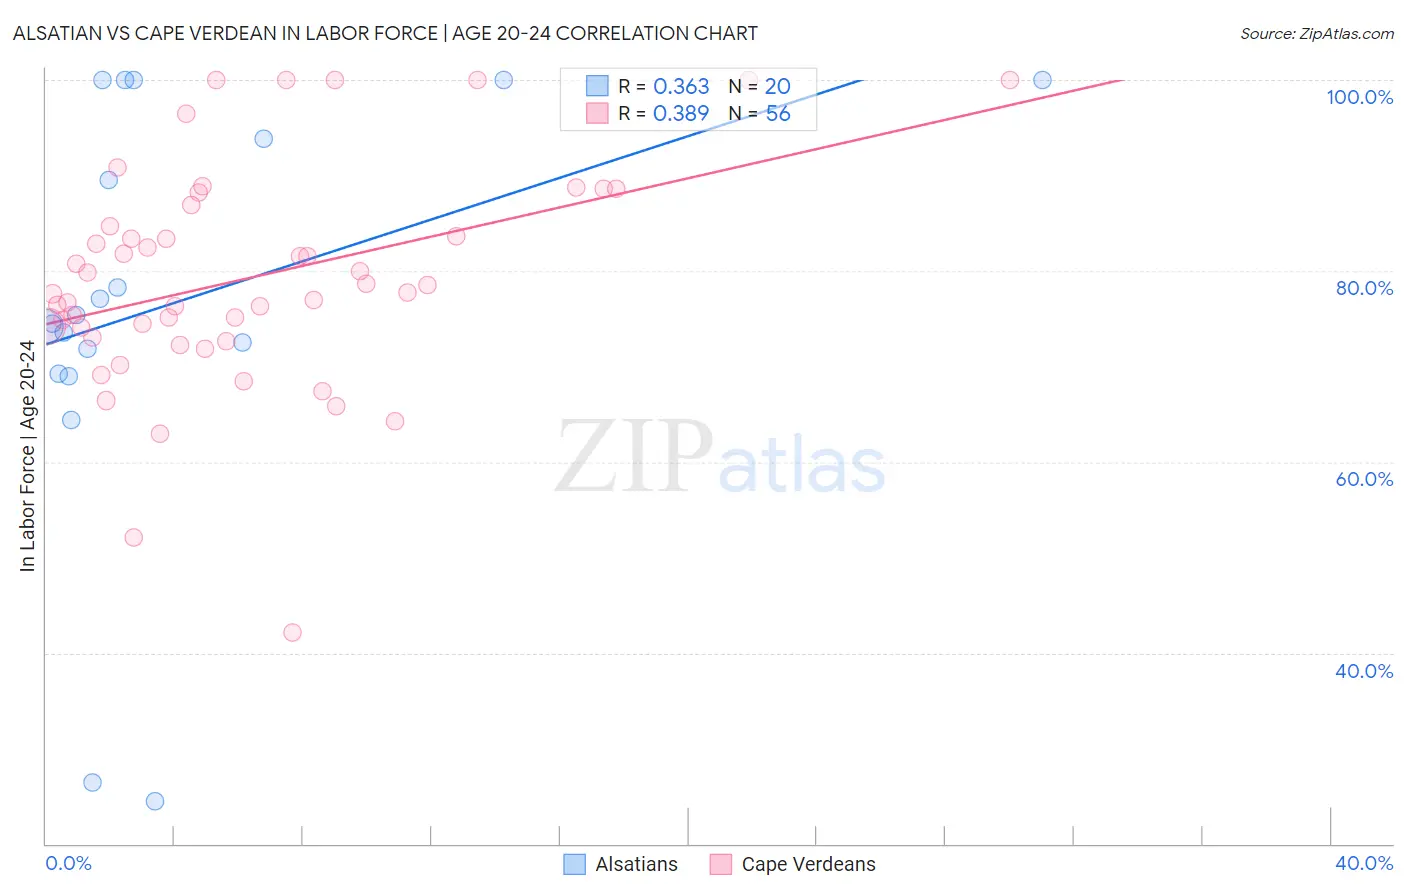
Alsatian vs Cape Verdean In Labor Force | Age 20-24 Correlation Chart
The statistical analysis conducted on geographies consisting of 82,637,215 people shows a mild positive correlation between the proportion of Alsatians and labor force participation rate among population between the ages 20 and 24 in the United States with a correlation coefficient (R) of 0.363 and weighted average of 74.8%. Similarly, the statistical analysis conducted on geographies consisting of 107,566,363 people shows a mild positive correlation between the proportion of Cape Verdeans and labor force participation rate among population between the ages 20 and 24 in the United States with a correlation coefficient (R) of 0.389 and weighted average of 78.3%, a difference of 4.8%.
In Labor Force | Age 20-24 Correlation Summary
| Measurement | Alsatian | Cape Verdean |
| Minimum | 24.4% | 42.1% |
| Maximum | 100.0% | 100.0% |
| Range | 75.6% | 57.9% |
| Mean | 76.7% | 79.3% |
| Median | 74.9% | 78.1% |
| Interquartile 25% (IQ1) | 70.5% | 73.6% |
| Interquartile 75% (IQ3) | 97.0% | 85.8% |
| Interquartile Range (IQR) | 26.5% | 12.2% |
| Standard Deviation (Sample) | 21.5% | 11.6% |
| Standard Deviation (Population) | 20.9% | 11.5% |
Similar Demographics by In Labor Force | Age 20-24
Demographics Similar to Alsatians by In Labor Force | Age 20-24
In terms of in labor force | age 20-24, the demographic groups most similar to Alsatians are Immigrants from Europe (74.8%, a difference of 0.010%), Senegalese (74.8%, a difference of 0.020%), Immigrants from Denmark (74.8%, a difference of 0.030%), Eastern European (74.8%, a difference of 0.030%), and Immigrants from Vietnam (74.7%, a difference of 0.040%).
| Demographics | Rating | Rank | In Labor Force | Age 20-24 |
| Immigrants | Eastern Europe | 33.8 /100 | #186 | Fair 74.9% |
| Immigrants | Honduras | 33.5 /100 | #187 | Fair 74.9% |
| Hondurans | 32.7 /100 | #188 | Fair 74.8% |
| Immigrants | Northern Europe | 32.6 /100 | #189 | Fair 74.8% |
| Russians | 32.2 /100 | #190 | Fair 74.8% |
| Senegalese | 28.1 /100 | #191 | Fair 74.8% |
| Immigrants | Europe | 27.5 /100 | #192 | Fair 74.8% |
| Alsatians | 27.1 /100 | #193 | Fair 74.8% |
| Immigrants | Denmark | 25.8 /100 | #194 | Fair 74.8% |
| Eastern Europeans | 25.4 /100 | #195 | Fair 74.8% |
| Immigrants | Vietnam | 25.1 /100 | #196 | Fair 74.7% |
| Panamanians | 25.0 /100 | #197 | Fair 74.7% |
| Immigrants | Nigeria | 24.2 /100 | #198 | Fair 74.7% |
| Taiwanese | 23.2 /100 | #199 | Fair 74.7% |
| Nigerians | 21.9 /100 | #200 | Fair 74.7% |
Demographics Similar to Cape Verdeans by In Labor Force | Age 20-24
In terms of in labor force | age 20-24, the demographic groups most similar to Cape Verdeans are Dutch (78.4%, a difference of 0.040%), Sudanese (78.4%, a difference of 0.090%), Czech (78.5%, a difference of 0.22%), Scandinavian (78.5%, a difference of 0.23%), and German (78.6%, a difference of 0.30%).
| Demographics | Rating | Rank | In Labor Force | Age 20-24 |
| Slovenes | 100.0 /100 | #10 | Exceptional 78.7% |
| Finns | 100.0 /100 | #11 | Exceptional 78.7% |
| Germans | 100.0 /100 | #12 | Exceptional 78.6% |
| Scandinavians | 100.0 /100 | #13 | Exceptional 78.5% |
| Czechs | 100.0 /100 | #14 | Exceptional 78.5% |
| Sudanese | 100.0 /100 | #15 | Exceptional 78.4% |
| Dutch | 100.0 /100 | #16 | Exceptional 78.4% |
| Cape Verdeans | 100.0 /100 | #17 | Exceptional 78.3% |
| Immigrants | Bosnia and Herzegovina | 100.0 /100 | #18 | Exceptional 78.1% |
| Bangladeshis | 100.0 /100 | #19 | Exceptional 78.1% |
| French Canadians | 100.0 /100 | #20 | Exceptional 78.1% |
| Puget Sound Salish | 100.0 /100 | #21 | Exceptional 78.0% |
| Pennsylvania Germans | 100.0 /100 | #22 | Exceptional 78.0% |
| Yugoslavians | 100.0 /100 | #23 | Exceptional 78.0% |
| Liberians | 100.0 /100 | #24 | Exceptional 78.0% |