Ghanaian vs Immigrants from Peru In Labor Force | Age 20-24
COMPARE
Ghanaian
Immigrants from Peru
In Labor Force | Age 20-24
In Labor Force | Age 20-24 Comparison
Ghanaians
Immigrants from Peru
74.3%
IN LABOR FORCE | AGE 20-24
6.2/ 100
METRIC RATING
225th/ 347
METRIC RANK
74.5%
IN LABOR FORCE | AGE 20-24
10.6/ 100
METRIC RATING
218th/ 347
METRIC RANK
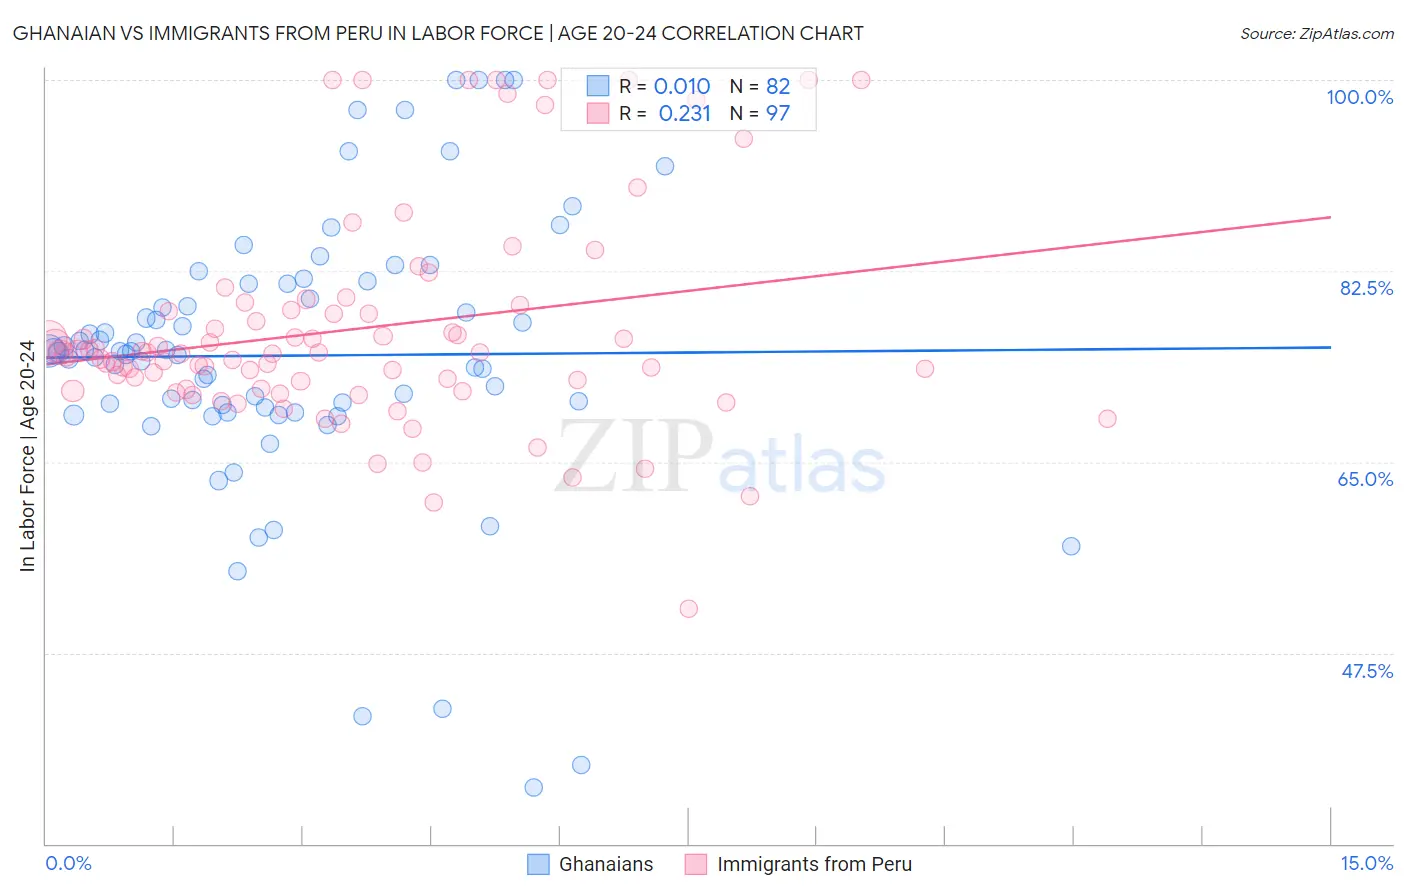
Ghanaian vs Immigrants from Peru In Labor Force | Age 20-24 Correlation Chart
The statistical analysis conducted on geographies consisting of 190,718,461 people shows no correlation between the proportion of Ghanaians and labor force participation rate among population between the ages 20 and 24 in the United States with a correlation coefficient (R) of 0.010 and weighted average of 74.3%. Similarly, the statistical analysis conducted on geographies consisting of 328,786,858 people shows a weak positive correlation between the proportion of Immigrants from Peru and labor force participation rate among population between the ages 20 and 24 in the United States with a correlation coefficient (R) of 0.231 and weighted average of 74.5%, a difference of 0.21%.
In Labor Force | Age 20-24 Correlation Summary
| Measurement | Ghanaian | Immigrants from Peru |
| Minimum | 35.2% | 51.5% |
| Maximum | 100.0% | 100.0% |
| Range | 64.8% | 48.5% |
| Mean | 74.7% | 77.2% |
| Median | 75.1% | 75.0% |
| Interquartile 25% (IQ1) | 70.0% | 71.7% |
| Interquartile 75% (IQ3) | 81.3% | 79.1% |
| Interquartile Range (IQR) | 11.3% | 7.5% |
| Standard Deviation (Sample) | 12.7% | 9.9% |
| Standard Deviation (Population) | 12.6% | 9.9% |
Demographics Similar to Ghanaians and Immigrants from Peru by In Labor Force | Age 20-24
In terms of in labor force | age 20-24, the demographic groups most similar to Ghanaians are Immigrants from Fiji (74.3%, a difference of 0.020%), Immigrants from Ireland (74.3%, a difference of 0.030%), Seminole (74.3%, a difference of 0.040%), Immigrants from Ukraine (74.2%, a difference of 0.080%), and Hispanic or Latino (74.4%, a difference of 0.10%). Similarly, the demographic groups most similar to Immigrants from Peru are Nepalese (74.5%, a difference of 0.0%), Immigrants from Norway (74.5%, a difference of 0.010%), Chickasaw (74.5%, a difference of 0.010%), Immigrants from India (74.4%, a difference of 0.030%), and Chilean (74.5%, a difference of 0.070%).
| Demographics | Rating | Rank | In Labor Force | Age 20-24 |
| Immigrants | Australia | 14.7 /100 | #211 | Poor 74.6% |
| Creek | 13.3 /100 | #212 | Poor 74.5% |
| Peruvians | 13.3 /100 | #213 | Poor 74.5% |
| Immigrants | Southern Europe | 13.2 /100 | #214 | Poor 74.5% |
| Immigrants | Ghana | 12.7 /100 | #215 | Poor 74.5% |
| Immigrants | Kuwait | 12.7 /100 | #216 | Poor 74.5% |
| Chileans | 12.5 /100 | #217 | Poor 74.5% |
| Immigrants | Peru | 10.6 /100 | #218 | Poor 74.5% |
| Nepalese | 10.5 /100 | #219 | Poor 74.5% |
| Immigrants | Norway | 10.3 /100 | #220 | Poor 74.5% |
| Chickasaw | 10.3 /100 | #221 | Poor 74.5% |
| Immigrants | India | 9.9 /100 | #222 | Tragic 74.4% |
| Hispanics or Latinos | 7.9 /100 | #223 | Tragic 74.4% |
| Seminole | 6.9 /100 | #224 | Tragic 74.3% |
| Ghanaians | 6.2 /100 | #225 | Tragic 74.3% |
| Immigrants | Fiji | 5.9 /100 | #226 | Tragic 74.3% |
| Immigrants | Ireland | 5.8 /100 | #227 | Tragic 74.3% |
| Immigrants | Ukraine | 5.1 /100 | #228 | Tragic 74.2% |
| Immigrants | Sweden | 4.6 /100 | #229 | Tragic 74.2% |
| Immigrants | Albania | 4.3 /100 | #230 | Tragic 74.2% |
| Immigrants | Greece | 4.1 /100 | #231 | Tragic 74.2% |