Ghanaian vs Immigrants from Latvia In Labor Force | Age 16-19
COMPARE
Ghanaian
Immigrants from Latvia
In Labor Force | Age 16-19
In Labor Force | Age 16-19 Comparison
Ghanaians
Immigrants from Latvia
35.3%
IN LABOR FORCE | AGE 16-19
6.5/ 100
METRIC RATING
223rd/ 347
METRIC RANK
36.8%
IN LABOR FORCE | AGE 16-19
61.6/ 100
METRIC RATING
169th/ 347
METRIC RANK
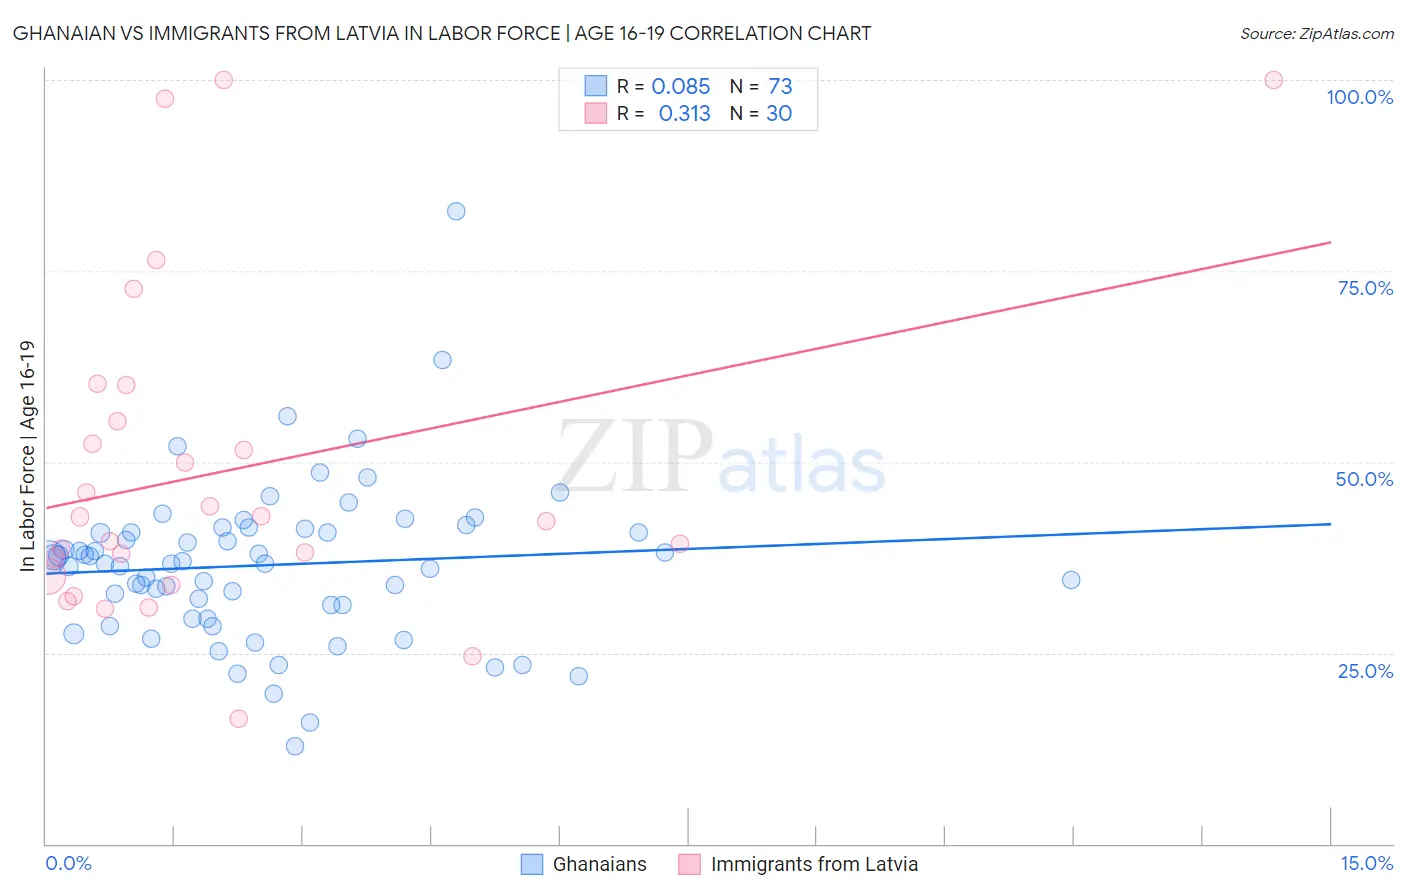
Ghanaian vs Immigrants from Latvia In Labor Force | Age 16-19 Correlation Chart
The statistical analysis conducted on geographies consisting of 190,615,931 people shows a slight positive correlation between the proportion of Ghanaians and labor force participation rate among population between the ages 16 and 19 in the United States with a correlation coefficient (R) of 0.085 and weighted average of 35.3%. Similarly, the statistical analysis conducted on geographies consisting of 113,686,535 people shows a mild positive correlation between the proportion of Immigrants from Latvia and labor force participation rate among population between the ages 16 and 19 in the United States with a correlation coefficient (R) of 0.313 and weighted average of 36.8%, a difference of 4.1%.
In Labor Force | Age 16-19 Correlation Summary
| Measurement | Ghanaian | Immigrants from Latvia |
| Minimum | 12.8% | 16.4% |
| Maximum | 82.8% | 100.0% |
| Range | 70.0% | 83.6% |
| Mean | 36.5% | 48.7% |
| Median | 36.7% | 42.6% |
| Interquartile 25% (IQ1) | 30.3% | 35.0% |
| Interquartile 75% (IQ3) | 41.0% | 55.3% |
| Interquartile Range (IQR) | 10.7% | 20.3% |
| Standard Deviation (Sample) | 10.4% | 21.4% |
| Standard Deviation (Population) | 10.4% | 21.1% |
Similar Demographics by In Labor Force | Age 16-19
Demographics Similar to Ghanaians by In Labor Force | Age 16-19
In terms of in labor force | age 16-19, the demographic groups most similar to Ghanaians are Honduran (35.3%, a difference of 0.020%), Immigrants from Belgium (35.3%, a difference of 0.090%), Immigrants from Ghana (35.4%, a difference of 0.15%), Turkish (35.4%, a difference of 0.16%), and Immigrants from Guatemala (35.3%, a difference of 0.19%).
| Demographics | Rating | Rank | In Labor Force | Age 16-19 |
| Dutch West Indians | 10.7 /100 | #216 | Poor 35.6% |
| Immigrants | Costa Rica | 10.7 /100 | #217 | Poor 35.6% |
| Sri Lankans | 9.8 /100 | #218 | Tragic 35.5% |
| Guatemalans | 8.6 /100 | #219 | Tragic 35.5% |
| Immigrants | Bahamas | 8.3 /100 | #220 | Tragic 35.5% |
| Turks | 7.3 /100 | #221 | Tragic 35.4% |
| Immigrants | Ghana | 7.3 /100 | #222 | Tragic 35.4% |
| Ghanaians | 6.5 /100 | #223 | Tragic 35.3% |
| Hondurans | 6.5 /100 | #224 | Tragic 35.3% |
| Immigrants | Belgium | 6.1 /100 | #225 | Tragic 35.3% |
| Immigrants | Guatemala | 5.7 /100 | #226 | Tragic 35.3% |
| Mongolians | 5.7 /100 | #227 | Tragic 35.3% |
| Immigrants | Senegal | 5.5 /100 | #228 | Tragic 35.3% |
| Immigrants | Lebanon | 5.0 /100 | #229 | Tragic 35.2% |
| Immigrants | Honduras | 4.9 /100 | #230 | Tragic 35.2% |
Demographics Similar to Immigrants from Latvia by In Labor Force | Age 16-19
In terms of in labor force | age 16-19, the demographic groups most similar to Immigrants from Latvia are Immigrants from South Africa (36.8%, a difference of 0.060%), Palestinian (36.8%, a difference of 0.080%), Arab (36.8%, a difference of 0.11%), Immigrants from Cambodia (36.7%, a difference of 0.17%), and South African (36.7%, a difference of 0.17%).
| Demographics | Rating | Rank | In Labor Force | Age 16-19 |
| Immigrants | Jordan | 69.5 /100 | #162 | Good 36.9% |
| Bermudans | 69.3 /100 | #163 | Good 36.9% |
| Immigrants | Kuwait | 68.9 /100 | #164 | Good 36.9% |
| Yakama | 66.9 /100 | #165 | Good 36.9% |
| Immigrants | Western Africa | 66.7 /100 | #166 | Good 36.9% |
| Arabs | 63.6 /100 | #167 | Good 36.8% |
| Palestinians | 63.1 /100 | #168 | Good 36.8% |
| Immigrants | Latvia | 61.6 /100 | #169 | Good 36.8% |
| Immigrants | South Africa | 60.5 /100 | #170 | Good 36.8% |
| Immigrants | Cambodia | 58.4 /100 | #171 | Average 36.7% |
| South Africans | 58.3 /100 | #172 | Average 36.7% |
| Russians | 57.5 /100 | #173 | Average 36.7% |
| Immigrants | Czechoslovakia | 50.0 /100 | #174 | Average 36.6% |
| Natives/Alaskans | 49.0 /100 | #175 | Average 36.6% |
| Albanians | 48.8 /100 | #176 | Average 36.5% |