Ghanaian vs Immigrants from Guatemala In Labor Force | Age 16-19
COMPARE
Ghanaian
Immigrants from Guatemala
In Labor Force | Age 16-19
In Labor Force | Age 16-19 Comparison
Ghanaians
Immigrants from Guatemala
35.3%
IN LABOR FORCE | AGE 16-19
6.5/ 100
METRIC RATING
223rd/ 347
METRIC RANK
35.3%
IN LABOR FORCE | AGE 16-19
5.7/ 100
METRIC RATING
226th/ 347
METRIC RANK
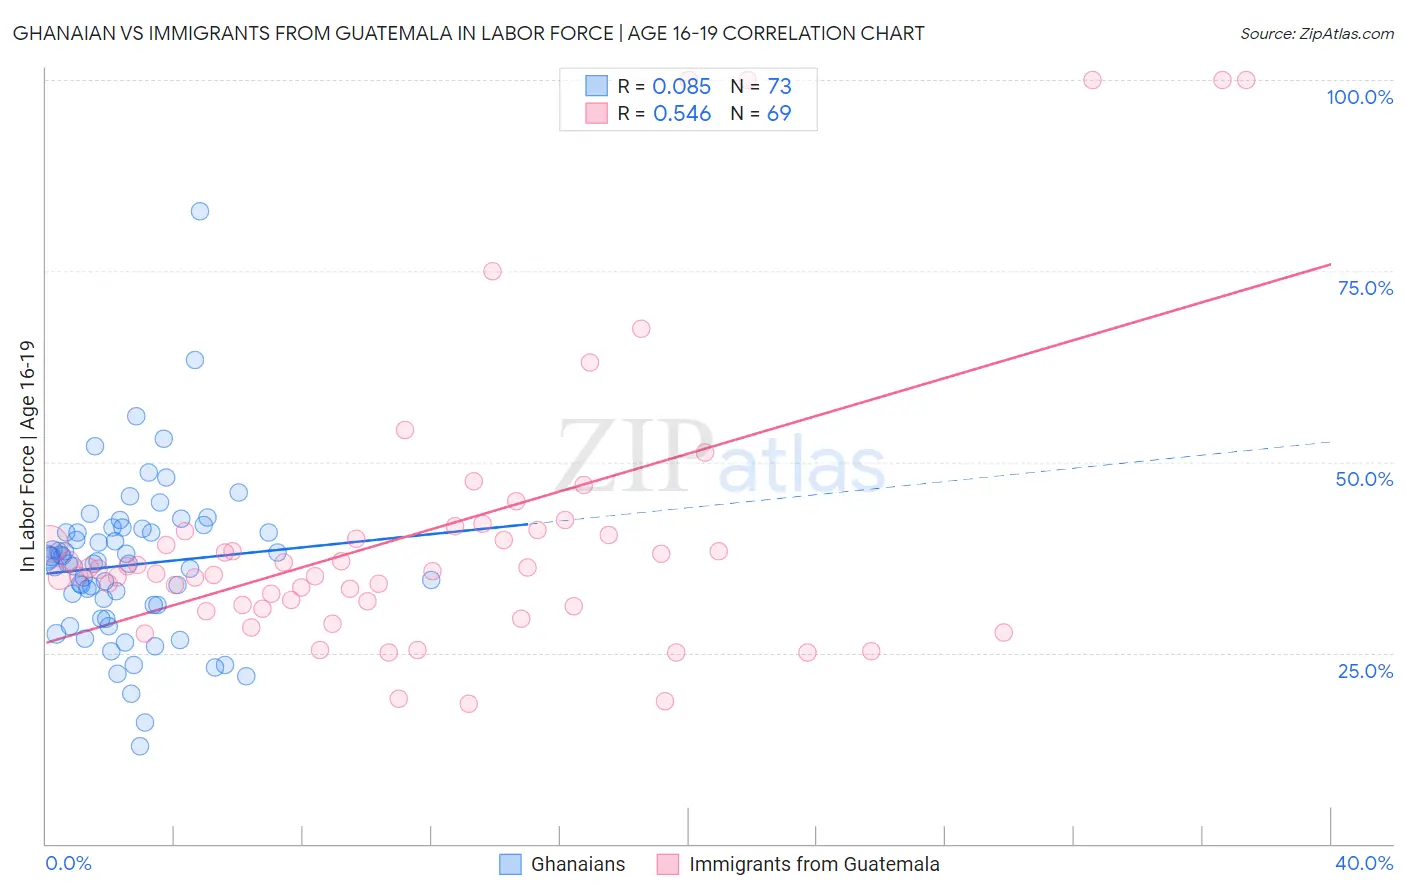
Ghanaian vs Immigrants from Guatemala In Labor Force | Age 16-19 Correlation Chart
The statistical analysis conducted on geographies consisting of 190,615,931 people shows a slight positive correlation between the proportion of Ghanaians and labor force participation rate among population between the ages 16 and 19 in the United States with a correlation coefficient (R) of 0.085 and weighted average of 35.3%. Similarly, the statistical analysis conducted on geographies consisting of 376,894,090 people shows a substantial positive correlation between the proportion of Immigrants from Guatemala and labor force participation rate among population between the ages 16 and 19 in the United States with a correlation coefficient (R) of 0.546 and weighted average of 35.3%, a difference of 0.19%.
In Labor Force | Age 16-19 Correlation Summary
| Measurement | Ghanaian | Immigrants from Guatemala |
| Minimum | 12.8% | 18.3% |
| Maximum | 82.8% | 100.0% |
| Range | 70.0% | 81.7% |
| Mean | 36.5% | 40.9% |
| Median | 36.7% | 36.0% |
| Interquartile 25% (IQ1) | 30.3% | 31.1% |
| Interquartile 75% (IQ3) | 41.0% | 41.0% |
| Interquartile Range (IQR) | 10.7% | 9.8% |
| Standard Deviation (Sample) | 10.4% | 19.3% |
| Standard Deviation (Population) | 10.4% | 19.2% |
Demographics Similar to Ghanaians and Immigrants from Guatemala by In Labor Force | Age 16-19
In terms of in labor force | age 16-19, the demographic groups most similar to Ghanaians are Honduran (35.3%, a difference of 0.020%), Immigrants from Belgium (35.3%, a difference of 0.090%), Immigrants from Ghana (35.4%, a difference of 0.15%), Turkish (35.4%, a difference of 0.16%), and Mongolian (35.3%, a difference of 0.20%). Similarly, the demographic groups most similar to Immigrants from Guatemala are Mongolian (35.3%, a difference of 0.010%), Immigrants from Senegal (35.3%, a difference of 0.060%), Immigrants from Belgium (35.3%, a difference of 0.090%), Honduran (35.3%, a difference of 0.17%), and Immigrants from Lebanon (35.2%, a difference of 0.19%).
| Demographics | Rating | Rank | In Labor Force | Age 16-19 |
| Apache | 11.0 /100 | #214 | Poor 35.6% |
| Immigrants | South Eastern Asia | 10.8 /100 | #215 | Poor 35.6% |
| Dutch West Indians | 10.7 /100 | #216 | Poor 35.6% |
| Immigrants | Costa Rica | 10.7 /100 | #217 | Poor 35.6% |
| Sri Lankans | 9.8 /100 | #218 | Tragic 35.5% |
| Guatemalans | 8.6 /100 | #219 | Tragic 35.5% |
| Immigrants | Bahamas | 8.3 /100 | #220 | Tragic 35.5% |
| Turks | 7.3 /100 | #221 | Tragic 35.4% |
| Immigrants | Ghana | 7.3 /100 | #222 | Tragic 35.4% |
| Ghanaians | 6.5 /100 | #223 | Tragic 35.3% |
| Hondurans | 6.5 /100 | #224 | Tragic 35.3% |
| Immigrants | Belgium | 6.1 /100 | #225 | Tragic 35.3% |
| Immigrants | Guatemala | 5.7 /100 | #226 | Tragic 35.3% |
| Mongolians | 5.7 /100 | #227 | Tragic 35.3% |
| Immigrants | Senegal | 5.5 /100 | #228 | Tragic 35.3% |
| Immigrants | Lebanon | 5.0 /100 | #229 | Tragic 35.2% |
| Immigrants | Honduras | 4.9 /100 | #230 | Tragic 35.2% |
| Immigrants | Syria | 4.5 /100 | #231 | Tragic 35.2% |
| Immigrants | Kazakhstan | 4.5 /100 | #232 | Tragic 35.2% |
| Immigrants | France | 4.3 /100 | #233 | Tragic 35.1% |
| Immigrants | Mexico | 4.2 /100 | #234 | Tragic 35.1% |