Immigrants from Romania vs Immigrants from Guatemala In Labor Force | Age 16-19
COMPARE
Immigrants from Romania
Immigrants from Guatemala
In Labor Force | Age 16-19
In Labor Force | Age 16-19 Comparison
Immigrants from Romania
Immigrants from Guatemala
36.3%
IN LABOR FORCE | AGE 16-19
34.0/ 100
METRIC RATING
186th/ 347
METRIC RANK
35.3%
IN LABOR FORCE | AGE 16-19
5.7/ 100
METRIC RATING
226th/ 347
METRIC RANK
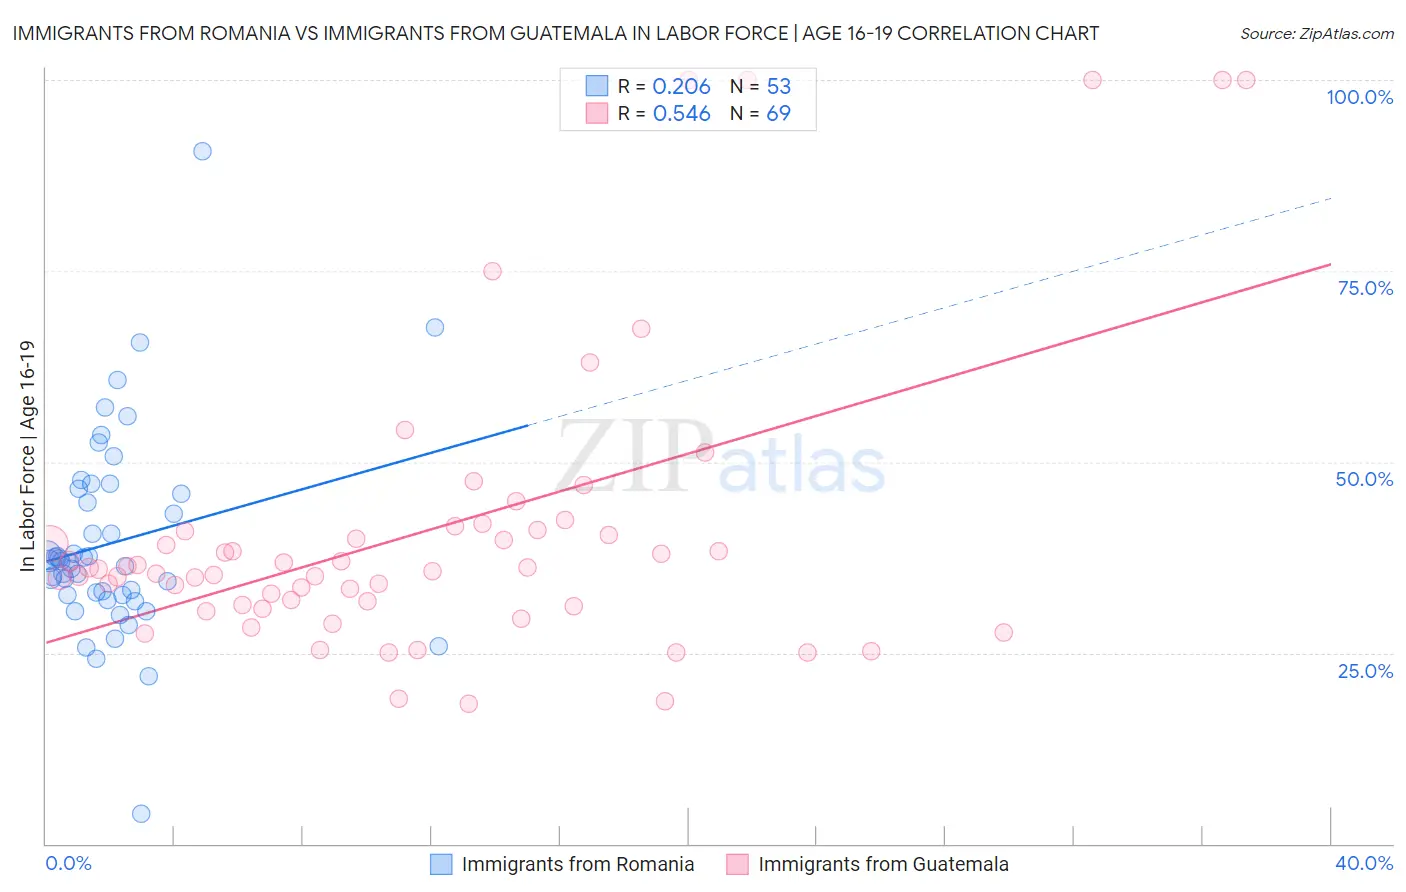
Immigrants from Romania vs Immigrants from Guatemala In Labor Force | Age 16-19 Correlation Chart
The statistical analysis conducted on geographies consisting of 256,696,852 people shows a weak positive correlation between the proportion of Immigrants from Romania and labor force participation rate among population between the ages 16 and 19 in the United States with a correlation coefficient (R) of 0.206 and weighted average of 36.3%. Similarly, the statistical analysis conducted on geographies consisting of 376,894,090 people shows a substantial positive correlation between the proportion of Immigrants from Guatemala and labor force participation rate among population between the ages 16 and 19 in the United States with a correlation coefficient (R) of 0.546 and weighted average of 35.3%, a difference of 2.8%.
In Labor Force | Age 16-19 Correlation Summary
| Measurement | Immigrants from Romania | Immigrants from Guatemala |
| Minimum | 3.9% | 18.3% |
| Maximum | 90.6% | 100.0% |
| Range | 86.7% | 81.7% |
| Mean | 39.4% | 40.9% |
| Median | 37.0% | 36.0% |
| Interquartile 25% (IQ1) | 32.6% | 31.1% |
| Interquartile 75% (IQ3) | 46.1% | 41.0% |
| Interquartile Range (IQR) | 13.6% | 9.8% |
| Standard Deviation (Sample) | 13.3% | 19.3% |
| Standard Deviation (Population) | 13.2% | 19.2% |
Similar Demographics by In Labor Force | Age 16-19
Demographics Similar to Immigrants from Romania by In Labor Force | Age 16-19
In terms of in labor force | age 16-19, the demographic groups most similar to Immigrants from Romania are Immigrants from Afghanistan (36.3%, a difference of 0.0%), Bhutanese (36.3%, a difference of 0.070%), Costa Rican (36.3%, a difference of 0.12%), Immigrants from Europe (36.2%, a difference of 0.13%), and Eastern European (36.4%, a difference of 0.27%).
| Demographics | Rating | Rank | In Labor Force | Age 16-19 |
| Immigrants | Southern Europe | 43.3 /100 | #179 | Average 36.4% |
| Immigrants | Morocco | 41.1 /100 | #180 | Average 36.4% |
| Jordanians | 39.6 /100 | #181 | Fair 36.4% |
| Immigrants | Italy | 39.1 /100 | #182 | Fair 36.4% |
| Eastern Europeans | 38.8 /100 | #183 | Fair 36.4% |
| Costa Ricans | 36.1 /100 | #184 | Fair 36.3% |
| Bhutanese | 35.3 /100 | #185 | Fair 36.3% |
| Immigrants | Romania | 34.0 /100 | #186 | Fair 36.3% |
| Immigrants | Afghanistan | 34.0 /100 | #187 | Fair 36.3% |
| Immigrants | Europe | 31.8 /100 | #188 | Fair 36.2% |
| Immigrants | Hungary | 28.8 /100 | #189 | Fair 36.2% |
| Panamanians | 28.6 /100 | #190 | Fair 36.1% |
| Immigrants | Croatia | 27.5 /100 | #191 | Fair 36.1% |
| Afghans | 25.7 /100 | #192 | Fair 36.1% |
| Immigrants | Denmark | 25.0 /100 | #193 | Fair 36.1% |
Demographics Similar to Immigrants from Guatemala by In Labor Force | Age 16-19
In terms of in labor force | age 16-19, the demographic groups most similar to Immigrants from Guatemala are Mongolian (35.3%, a difference of 0.010%), Immigrants from Senegal (35.3%, a difference of 0.060%), Immigrants from Belgium (35.3%, a difference of 0.090%), Honduran (35.3%, a difference of 0.17%), and Ghanaian (35.3%, a difference of 0.19%).
| Demographics | Rating | Rank | In Labor Force | Age 16-19 |
| Guatemalans | 8.6 /100 | #219 | Tragic 35.5% |
| Immigrants | Bahamas | 8.3 /100 | #220 | Tragic 35.5% |
| Turks | 7.3 /100 | #221 | Tragic 35.4% |
| Immigrants | Ghana | 7.3 /100 | #222 | Tragic 35.4% |
| Ghanaians | 6.5 /100 | #223 | Tragic 35.3% |
| Hondurans | 6.5 /100 | #224 | Tragic 35.3% |
| Immigrants | Belgium | 6.1 /100 | #225 | Tragic 35.3% |
| Immigrants | Guatemala | 5.7 /100 | #226 | Tragic 35.3% |
| Mongolians | 5.7 /100 | #227 | Tragic 35.3% |
| Immigrants | Senegal | 5.5 /100 | #228 | Tragic 35.3% |
| Immigrants | Lebanon | 5.0 /100 | #229 | Tragic 35.2% |
| Immigrants | Honduras | 4.9 /100 | #230 | Tragic 35.2% |
| Immigrants | Syria | 4.5 /100 | #231 | Tragic 35.2% |
| Immigrants | Kazakhstan | 4.5 /100 | #232 | Tragic 35.2% |
| Immigrants | France | 4.3 /100 | #233 | Tragic 35.1% |