Spanish American Indian vs Immigrants from Guatemala In Labor Force | Age 16-19
COMPARE
Spanish American Indian
Immigrants from Guatemala
In Labor Force | Age 16-19
In Labor Force | Age 16-19 Comparison
Spanish American Indians
Immigrants from Guatemala
32.4%
IN LABOR FORCE | AGE 16-19
0.0/ 100
METRIC RATING
306th/ 347
METRIC RANK
35.3%
IN LABOR FORCE | AGE 16-19
5.7/ 100
METRIC RATING
226th/ 347
METRIC RANK
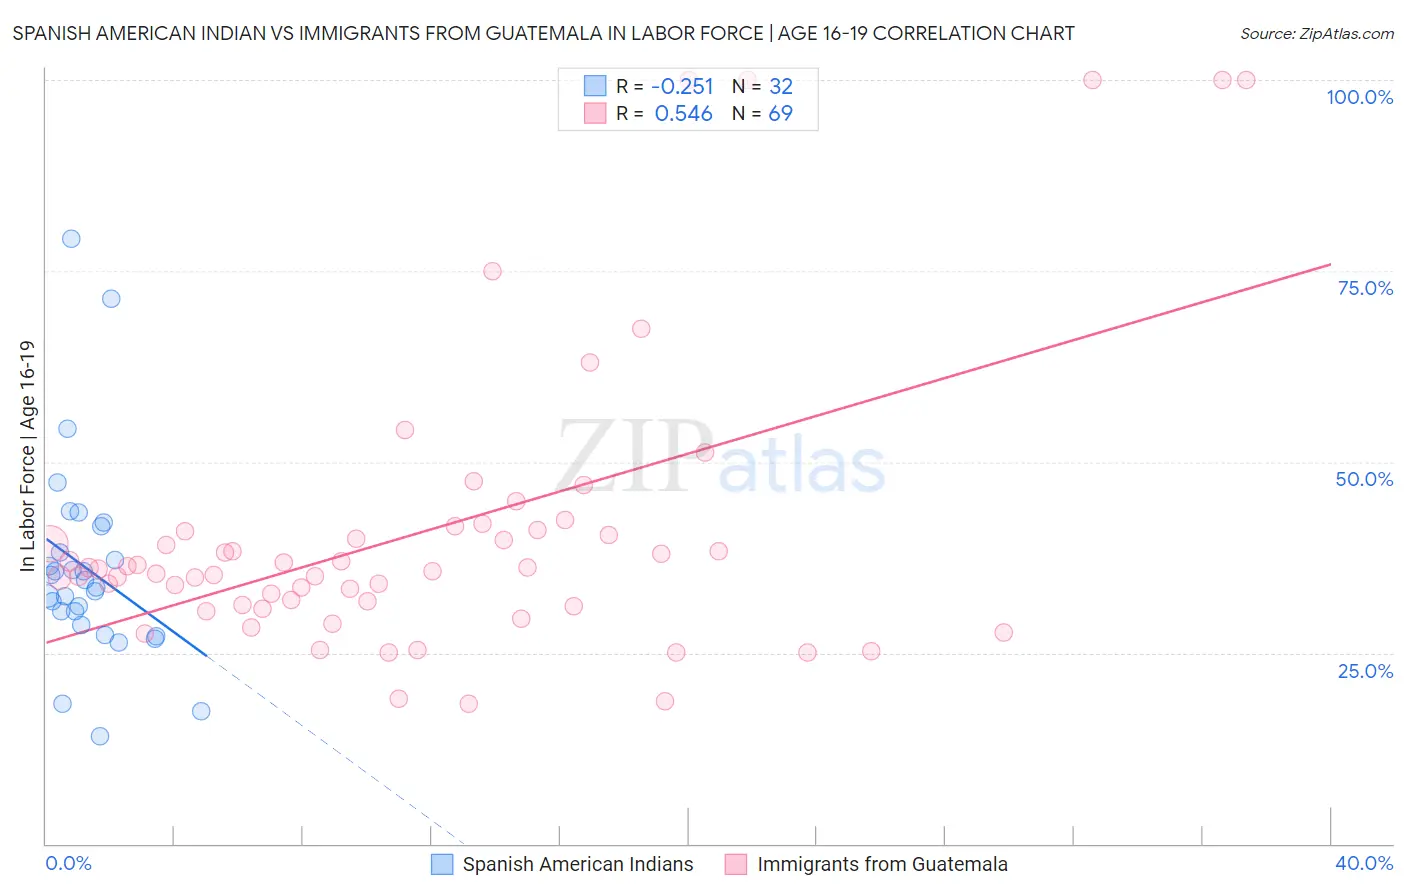
Spanish American Indian vs Immigrants from Guatemala In Labor Force | Age 16-19 Correlation Chart
The statistical analysis conducted on geographies consisting of 73,134,655 people shows a weak negative correlation between the proportion of Spanish American Indians and labor force participation rate among population between the ages 16 and 19 in the United States with a correlation coefficient (R) of -0.251 and weighted average of 32.4%. Similarly, the statistical analysis conducted on geographies consisting of 376,894,090 people shows a substantial positive correlation between the proportion of Immigrants from Guatemala and labor force participation rate among population between the ages 16 and 19 in the United States with a correlation coefficient (R) of 0.546 and weighted average of 35.3%, a difference of 9.0%.
In Labor Force | Age 16-19 Correlation Summary
| Measurement | Spanish American Indian | Immigrants from Guatemala |
| Minimum | 14.1% | 18.3% |
| Maximum | 79.2% | 100.0% |
| Range | 65.1% | 81.7% |
| Mean | 36.0% | 40.9% |
| Median | 34.0% | 36.0% |
| Interquartile 25% (IQ1) | 29.6% | 31.1% |
| Interquartile 75% (IQ3) | 39.9% | 41.0% |
| Interquartile Range (IQR) | 10.3% | 9.8% |
| Standard Deviation (Sample) | 13.2% | 19.3% |
| Standard Deviation (Population) | 13.0% | 19.2% |
Similar Demographics by In Labor Force | Age 16-19
Demographics Similar to Spanish American Indians by In Labor Force | Age 16-19
In terms of in labor force | age 16-19, the demographic groups most similar to Spanish American Indians are Nicaraguan (32.4%, a difference of 0.13%), Israeli (32.4%, a difference of 0.18%), Immigrants from Dominica (32.5%, a difference of 0.37%), Immigrants from Jamaica (32.2%, a difference of 0.49%), and Navajo (32.1%, a difference of 0.84%).
| Demographics | Rating | Rank | In Labor Force | Age 16-19 |
| Armenians | 0.0 /100 | #299 | Tragic 32.9% |
| Immigrants | Argentina | 0.0 /100 | #300 | Tragic 32.9% |
| Okinawans | 0.0 /100 | #301 | Tragic 32.8% |
| Belizeans | 0.0 /100 | #302 | Tragic 32.8% |
| Immigrants | Dominica | 0.0 /100 | #303 | Tragic 32.5% |
| Israelis | 0.0 /100 | #304 | Tragic 32.4% |
| Nicaraguans | 0.0 /100 | #305 | Tragic 32.4% |
| Spanish American Indians | 0.0 /100 | #306 | Tragic 32.4% |
| Immigrants | Jamaica | 0.0 /100 | #307 | Tragic 32.2% |
| Navajo | 0.0 /100 | #308 | Tragic 32.1% |
| Immigrants | Eastern Asia | 0.0 /100 | #309 | Tragic 32.0% |
| Immigrants | Iran | 0.0 /100 | #310 | Tragic 32.0% |
| Indians (Asian) | 0.0 /100 | #311 | Tragic 31.9% |
| Immigrants | Belize | 0.0 /100 | #312 | Tragic 31.8% |
| Hopi | 0.0 /100 | #313 | Tragic 31.8% |
Demographics Similar to Immigrants from Guatemala by In Labor Force | Age 16-19
In terms of in labor force | age 16-19, the demographic groups most similar to Immigrants from Guatemala are Mongolian (35.3%, a difference of 0.010%), Immigrants from Senegal (35.3%, a difference of 0.060%), Immigrants from Belgium (35.3%, a difference of 0.090%), Honduran (35.3%, a difference of 0.17%), and Ghanaian (35.3%, a difference of 0.19%).
| Demographics | Rating | Rank | In Labor Force | Age 16-19 |
| Guatemalans | 8.6 /100 | #219 | Tragic 35.5% |
| Immigrants | Bahamas | 8.3 /100 | #220 | Tragic 35.5% |
| Turks | 7.3 /100 | #221 | Tragic 35.4% |
| Immigrants | Ghana | 7.3 /100 | #222 | Tragic 35.4% |
| Ghanaians | 6.5 /100 | #223 | Tragic 35.3% |
| Hondurans | 6.5 /100 | #224 | Tragic 35.3% |
| Immigrants | Belgium | 6.1 /100 | #225 | Tragic 35.3% |
| Immigrants | Guatemala | 5.7 /100 | #226 | Tragic 35.3% |
| Mongolians | 5.7 /100 | #227 | Tragic 35.3% |
| Immigrants | Senegal | 5.5 /100 | #228 | Tragic 35.3% |
| Immigrants | Lebanon | 5.0 /100 | #229 | Tragic 35.2% |
| Immigrants | Honduras | 4.9 /100 | #230 | Tragic 35.2% |
| Immigrants | Syria | 4.5 /100 | #231 | Tragic 35.2% |
| Immigrants | Kazakhstan | 4.5 /100 | #232 | Tragic 35.2% |
| Immigrants | France | 4.3 /100 | #233 | Tragic 35.1% |