Ethiopian vs Immigrants from Guatemala In Labor Force | Age 16-19
COMPARE
Ethiopian
Immigrants from Guatemala
In Labor Force | Age 16-19
In Labor Force | Age 16-19 Comparison
Ethiopians
Immigrants from Guatemala
38.2%
IN LABOR FORCE | AGE 16-19
97.4/ 100
METRIC RATING
121st/ 347
METRIC RANK
35.3%
IN LABOR FORCE | AGE 16-19
5.7/ 100
METRIC RATING
226th/ 347
METRIC RANK
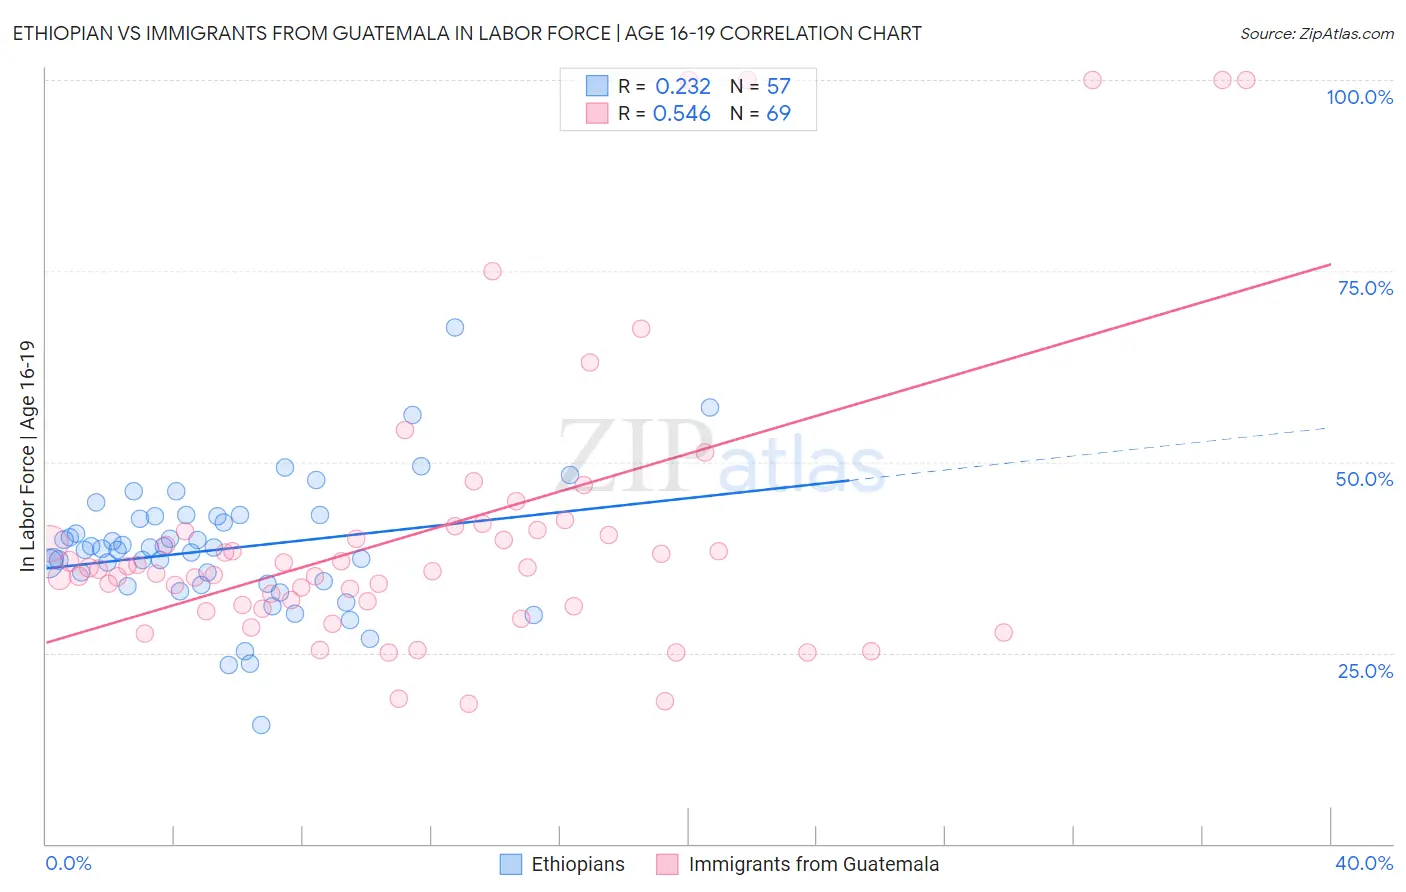
Ethiopian vs Immigrants from Guatemala In Labor Force | Age 16-19 Correlation Chart
The statistical analysis conducted on geographies consisting of 223,172,424 people shows a weak positive correlation between the proportion of Ethiopians and labor force participation rate among population between the ages 16 and 19 in the United States with a correlation coefficient (R) of 0.232 and weighted average of 38.2%. Similarly, the statistical analysis conducted on geographies consisting of 376,894,090 people shows a substantial positive correlation between the proportion of Immigrants from Guatemala and labor force participation rate among population between the ages 16 and 19 in the United States with a correlation coefficient (R) of 0.546 and weighted average of 35.3%, a difference of 8.4%.
In Labor Force | Age 16-19 Correlation Summary
| Measurement | Ethiopian | Immigrants from Guatemala |
| Minimum | 15.6% | 18.3% |
| Maximum | 67.6% | 100.0% |
| Range | 52.0% | 81.7% |
| Mean | 38.6% | 40.9% |
| Median | 38.6% | 36.0% |
| Interquartile 25% (IQ1) | 34.0% | 31.1% |
| Interquartile 75% (IQ3) | 42.8% | 41.0% |
| Interquartile Range (IQR) | 8.9% | 9.8% |
| Standard Deviation (Sample) | 8.5% | 19.3% |
| Standard Deviation (Population) | 8.4% | 19.2% |
Similar Demographics by In Labor Force | Age 16-19
Demographics Similar to Ethiopians by In Labor Force | Age 16-19
In terms of in labor force | age 16-19, the demographic groups most similar to Ethiopians are Guamanian/Chamorro (38.2%, a difference of 0.030%), Ukrainian (38.3%, a difference of 0.11%), Assyrian/Chaldean/Syriac (38.3%, a difference of 0.19%), Immigrants from Nepal (38.3%, a difference of 0.21%), and Chickasaw (38.3%, a difference of 0.22%).
| Demographics | Rating | Rank | In Labor Force | Age 16-19 |
| Hawaiians | 98.2 /100 | #114 | Exceptional 38.4% |
| Bulgarians | 97.9 /100 | #115 | Exceptional 38.3% |
| Colville | 97.9 /100 | #116 | Exceptional 38.3% |
| Chickasaw | 97.8 /100 | #117 | Exceptional 38.3% |
| Immigrants | Nepal | 97.8 /100 | #118 | Exceptional 38.3% |
| Assyrians/Chaldeans/Syriacs | 97.8 /100 | #119 | Exceptional 38.3% |
| Ukrainians | 97.6 /100 | #120 | Exceptional 38.3% |
| Ethiopians | 97.4 /100 | #121 | Exceptional 38.2% |
| Guamanians/Chamorros | 97.4 /100 | #122 | Exceptional 38.2% |
| Seminole | 96.7 /100 | #123 | Exceptional 38.1% |
| Immigrants | England | 96.4 /100 | #124 | Exceptional 38.1% |
| Immigrants | Africa | 96.1 /100 | #125 | Exceptional 38.0% |
| Africans | 95.6 /100 | #126 | Exceptional 38.0% |
| Choctaw | 95.6 /100 | #127 | Exceptional 38.0% |
| New Zealanders | 95.6 /100 | #128 | Exceptional 38.0% |
Demographics Similar to Immigrants from Guatemala by In Labor Force | Age 16-19
In terms of in labor force | age 16-19, the demographic groups most similar to Immigrants from Guatemala are Mongolian (35.3%, a difference of 0.010%), Immigrants from Senegal (35.3%, a difference of 0.060%), Immigrants from Belgium (35.3%, a difference of 0.090%), Honduran (35.3%, a difference of 0.17%), and Ghanaian (35.3%, a difference of 0.19%).
| Demographics | Rating | Rank | In Labor Force | Age 16-19 |
| Guatemalans | 8.6 /100 | #219 | Tragic 35.5% |
| Immigrants | Bahamas | 8.3 /100 | #220 | Tragic 35.5% |
| Turks | 7.3 /100 | #221 | Tragic 35.4% |
| Immigrants | Ghana | 7.3 /100 | #222 | Tragic 35.4% |
| Ghanaians | 6.5 /100 | #223 | Tragic 35.3% |
| Hondurans | 6.5 /100 | #224 | Tragic 35.3% |
| Immigrants | Belgium | 6.1 /100 | #225 | Tragic 35.3% |
| Immigrants | Guatemala | 5.7 /100 | #226 | Tragic 35.3% |
| Mongolians | 5.7 /100 | #227 | Tragic 35.3% |
| Immigrants | Senegal | 5.5 /100 | #228 | Tragic 35.3% |
| Immigrants | Lebanon | 5.0 /100 | #229 | Tragic 35.2% |
| Immigrants | Honduras | 4.9 /100 | #230 | Tragic 35.2% |
| Immigrants | Syria | 4.5 /100 | #231 | Tragic 35.2% |
| Immigrants | Kazakhstan | 4.5 /100 | #232 | Tragic 35.2% |
| Immigrants | France | 4.3 /100 | #233 | Tragic 35.1% |