Ghanaian vs Immigrants from Guatemala In Labor Force | Age 25-29
COMPARE
Ghanaian
Immigrants from Guatemala
In Labor Force | Age 25-29
In Labor Force | Age 25-29 Comparison
Ghanaians
Immigrants from Guatemala
84.7%
IN LABOR FORCE | AGE 25-29
57.6/ 100
METRIC RATING
164th/ 347
METRIC RANK
83.6%
IN LABOR FORCE | AGE 25-29
0.1/ 100
METRIC RATING
258th/ 347
METRIC RANK
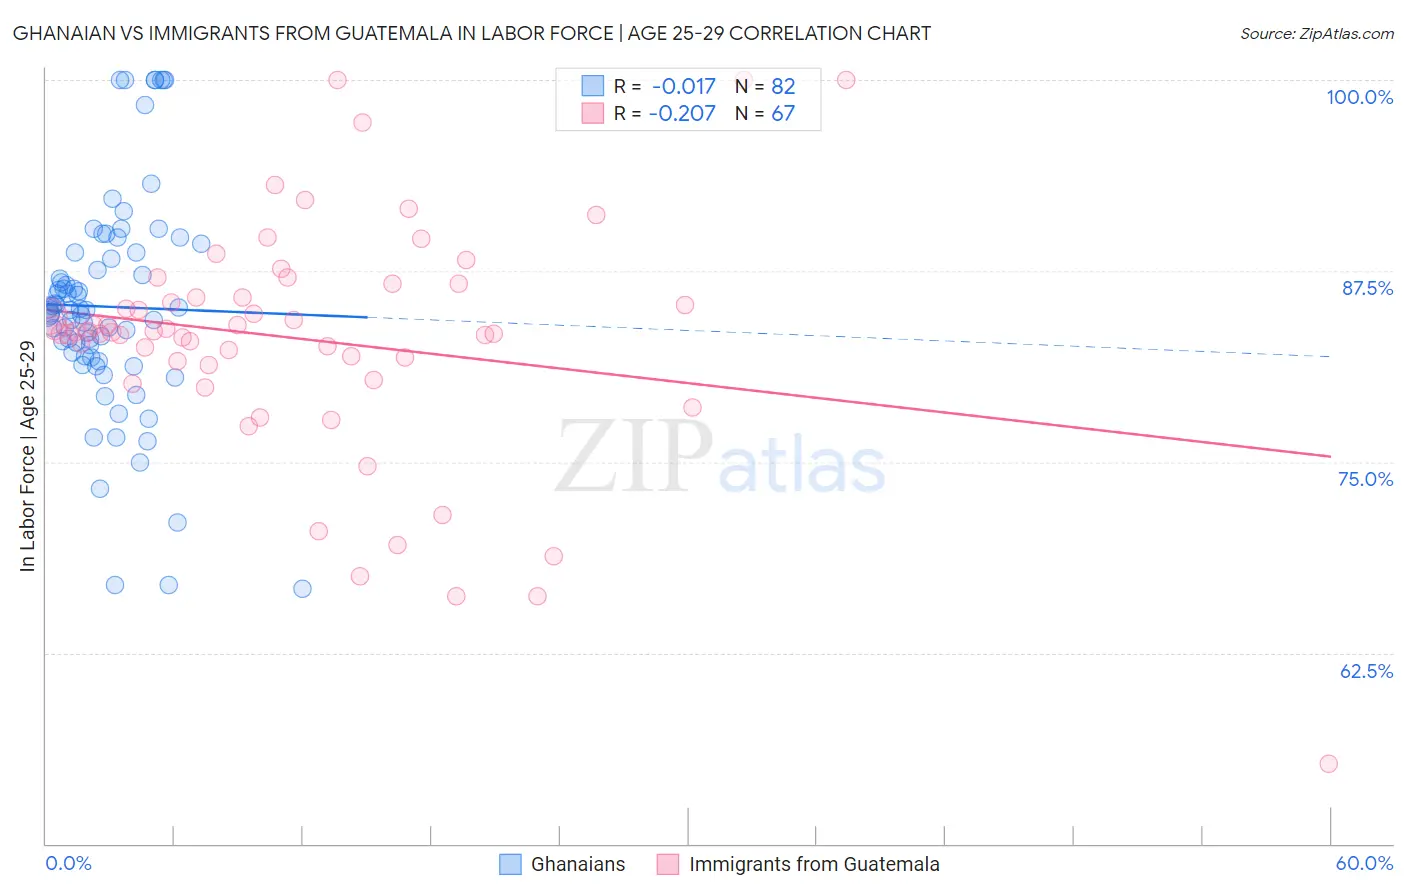
Ghanaian vs Immigrants from Guatemala In Labor Force | Age 25-29 Correlation Chart
The statistical analysis conducted on geographies consisting of 190,676,987 people shows no correlation between the proportion of Ghanaians and labor force participation rate among population between the ages 25 and 29 in the United States with a correlation coefficient (R) of -0.017 and weighted average of 84.7%. Similarly, the statistical analysis conducted on geographies consisting of 377,188,709 people shows a weak negative correlation between the proportion of Immigrants from Guatemala and labor force participation rate among population between the ages 25 and 29 in the United States with a correlation coefficient (R) of -0.207 and weighted average of 83.6%, a difference of 1.3%.
In Labor Force | Age 25-29 Correlation Summary
| Measurement | Ghanaian | Immigrants from Guatemala |
| Minimum | 66.7% | 55.2% |
| Maximum | 100.0% | 100.0% |
| Range | 33.3% | 44.8% |
| Mean | 85.2% | 83.0% |
| Median | 84.9% | 83.5% |
| Interquartile 25% (IQ1) | 81.9% | 81.4% |
| Interquartile 75% (IQ3) | 88.7% | 86.6% |
| Interquartile Range (IQR) | 6.8% | 5.3% |
| Standard Deviation (Sample) | 7.1% | 7.9% |
| Standard Deviation (Population) | 7.1% | 7.8% |
Similar Demographics by In Labor Force | Age 25-29
Demographics Similar to Ghanaians by In Labor Force | Age 25-29
In terms of in labor force | age 25-29, the demographic groups most similar to Ghanaians are Immigrants from Colombia (84.7%, a difference of 0.0%), Argentinean (84.7%, a difference of 0.0%), Immigrants from Burma/Myanmar (84.7%, a difference of 0.0%), Immigrants from Peru (84.7%, a difference of 0.010%), and Canadian (84.7%, a difference of 0.010%).
| Demographics | Rating | Rank | In Labor Force | Age 25-29 |
| British | 60.4 /100 | #157 | Good 84.7% |
| Immigrants | Ghana | 60.2 /100 | #158 | Good 84.7% |
| Immigrants | Western Africa | 60.1 /100 | #159 | Good 84.7% |
| Immigrants | Peru | 58.6 /100 | #160 | Average 84.7% |
| Canadians | 58.5 /100 | #161 | Average 84.7% |
| Immigrants | Colombia | 58.3 /100 | #162 | Average 84.7% |
| Argentineans | 57.9 /100 | #163 | Average 84.7% |
| Ghanaians | 57.6 /100 | #164 | Average 84.7% |
| Immigrants | Burma/Myanmar | 57.4 /100 | #165 | Average 84.7% |
| Immigrants | Spain | 56.9 /100 | #166 | Average 84.7% |
| Indonesians | 56.5 /100 | #167 | Average 84.7% |
| South Americans | 54.9 /100 | #168 | Average 84.7% |
| Celtics | 52.5 /100 | #169 | Average 84.7% |
| Tongans | 52.4 /100 | #170 | Average 84.7% |
| Immigrants | Vietnam | 50.5 /100 | #171 | Average 84.7% |
Demographics Similar to Immigrants from Guatemala by In Labor Force | Age 25-29
In terms of in labor force | age 25-29, the demographic groups most similar to Immigrants from Guatemala are Spanish (83.6%, a difference of 0.010%), Immigrants from Bahamas (83.6%, a difference of 0.020%), Pennsylvania German (83.6%, a difference of 0.020%), Delaware (83.7%, a difference of 0.040%), and Immigrants from Haiti (83.7%, a difference of 0.050%).
| Demographics | Rating | Rank | In Labor Force | Age 25-29 |
| Bahamians | 0.2 /100 | #251 | Tragic 83.7% |
| Guatemalans | 0.2 /100 | #252 | Tragic 83.7% |
| Immigrants | Trinidad and Tobago | 0.2 /100 | #253 | Tragic 83.7% |
| Spaniards | 0.2 /100 | #254 | Tragic 83.7% |
| Haitians | 0.2 /100 | #255 | Tragic 83.7% |
| Immigrants | Haiti | 0.2 /100 | #256 | Tragic 83.7% |
| Delaware | 0.2 /100 | #257 | Tragic 83.7% |
| Immigrants | Guatemala | 0.1 /100 | #258 | Tragic 83.6% |
| Spanish | 0.1 /100 | #259 | Tragic 83.6% |
| Immigrants | Bahamas | 0.1 /100 | #260 | Tragic 83.6% |
| Pennsylvania Germans | 0.1 /100 | #261 | Tragic 83.6% |
| Immigrants | Fiji | 0.1 /100 | #262 | Tragic 83.6% |
| West Indians | 0.1 /100 | #263 | Tragic 83.5% |
| Puget Sound Salish | 0.1 /100 | #264 | Tragic 83.5% |
| Cubans | 0.1 /100 | #265 | Tragic 83.5% |