French American Indian vs Creek In Labor Force | Age 20-64
COMPARE
French American Indian
Creek
In Labor Force | Age 20-64
In Labor Force | Age 20-64 Comparison
French American Indians
Creek
78.2%
IN LABOR FORCE | AGE 20-64
0.0/ 100
METRIC RATING
273rd/ 347
METRIC RANK
75.1%
IN LABOR FORCE | AGE 20-64
0.0/ 100
METRIC RATING
326th/ 347
METRIC RANK
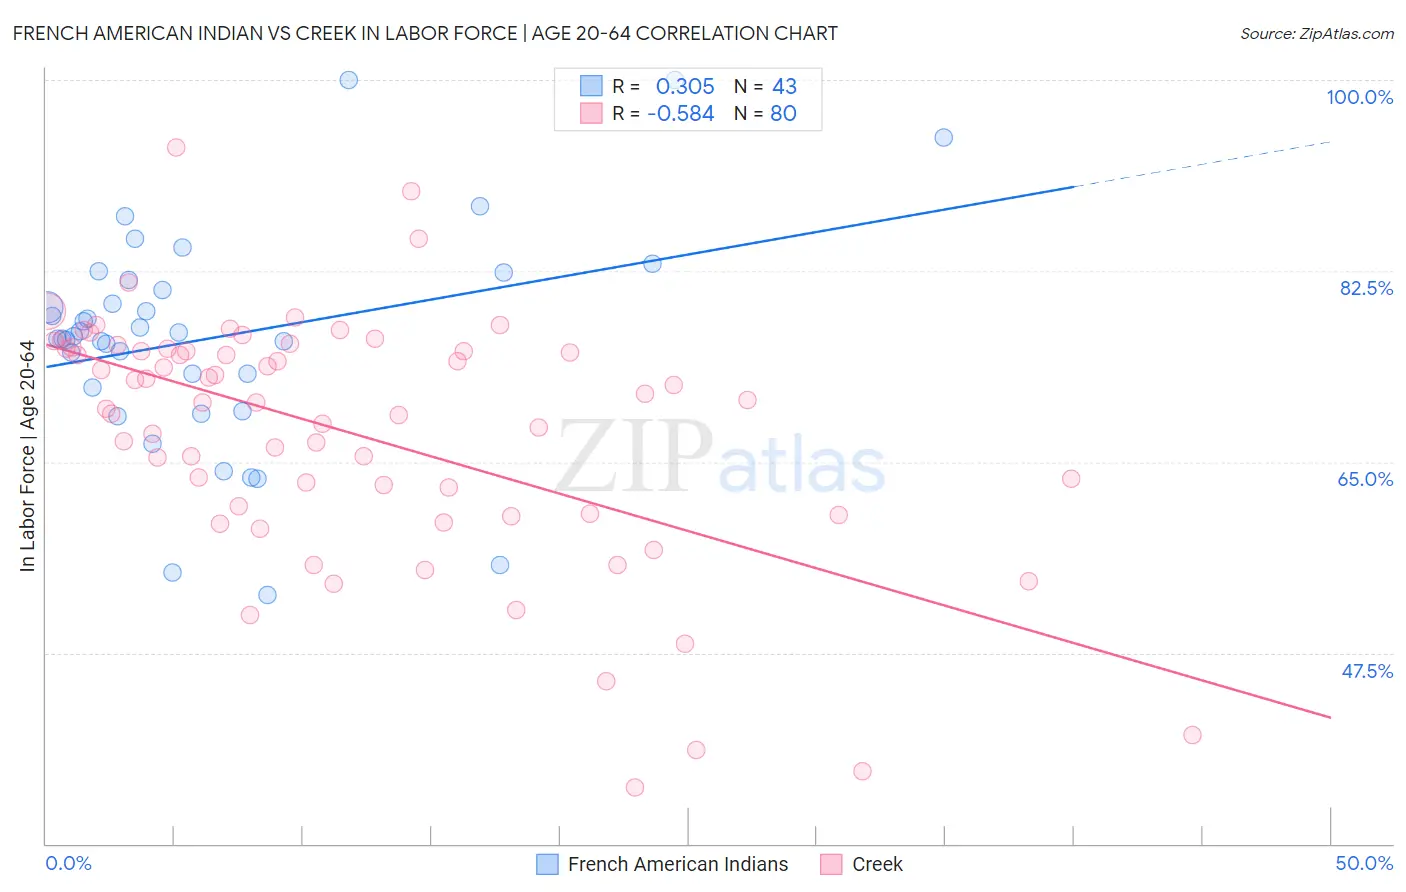
French American Indian vs Creek In Labor Force | Age 20-64 Correlation Chart
The statistical analysis conducted on geographies consisting of 131,974,215 people shows a mild positive correlation between the proportion of French American Indians and labor force participation rate among population between the ages 20 and 64 in the United States with a correlation coefficient (R) of 0.305 and weighted average of 78.2%. Similarly, the statistical analysis conducted on geographies consisting of 178,467,518 people shows a substantial negative correlation between the proportion of Creek and labor force participation rate among population between the ages 20 and 64 in the United States with a correlation coefficient (R) of -0.584 and weighted average of 75.1%, a difference of 4.1%.
In Labor Force | Age 20-64 Correlation Summary
| Measurement | French American Indian | Creek |
| Minimum | 52.8% | 35.2% |
| Maximum | 100.0% | 93.8% |
| Range | 47.2% | 58.6% |
| Mean | 76.4% | 67.7% |
| Median | 76.5% | 70.6% |
| Interquartile 25% (IQ1) | 71.9% | 60.6% |
| Interquartile 75% (IQ3) | 81.7% | 75.4% |
| Interquartile Range (IQR) | 9.8% | 14.8% |
| Standard Deviation (Sample) | 10.1% | 11.5% |
| Standard Deviation (Population) | 10.0% | 11.4% |
Similar Demographics by In Labor Force | Age 20-64
Demographics Similar to French American Indians by In Labor Force | Age 20-64
In terms of in labor force | age 20-64, the demographic groups most similar to French American Indians are Aleut (78.2%, a difference of 0.020%), Spanish (78.2%, a difference of 0.030%), Puget Sound Salish (78.2%, a difference of 0.030%), Marshallese (78.3%, a difference of 0.040%), and Immigrants from Latin America (78.3%, a difference of 0.050%).
| Demographics | Rating | Rank | In Labor Force | Age 20-64 |
| Bahamians | 0.1 /100 | #266 | Tragic 78.4% |
| U.S. Virgin Islanders | 0.1 /100 | #267 | Tragic 78.4% |
| West Indians | 0.0 /100 | #268 | Tragic 78.3% |
| Immigrants | Barbados | 0.0 /100 | #269 | Tragic 78.3% |
| Scotch-Irish | 0.0 /100 | #270 | Tragic 78.3% |
| Immigrants | Latin America | 0.0 /100 | #271 | Tragic 78.3% |
| Marshallese | 0.0 /100 | #272 | Tragic 78.3% |
| French American Indians | 0.0 /100 | #273 | Tragic 78.2% |
| Aleuts | 0.0 /100 | #274 | Tragic 78.2% |
| Spanish | 0.0 /100 | #275 | Tragic 78.2% |
| Puget Sound Salish | 0.0 /100 | #276 | Tragic 78.2% |
| Immigrants | Bahamas | 0.0 /100 | #277 | Tragic 78.2% |
| Mexican American Indians | 0.0 /100 | #278 | Tragic 78.2% |
| Belizeans | 0.0 /100 | #279 | Tragic 78.2% |
| Immigrants | Dominica | 0.0 /100 | #280 | Tragic 78.1% |
Demographics Similar to Creek by In Labor Force | Age 20-64
In terms of in labor force | age 20-64, the demographic groups most similar to Creek are Sioux (75.0%, a difference of 0.18%), Kiowa (75.0%, a difference of 0.20%), Menominee (75.3%, a difference of 0.22%), Choctaw (75.4%, a difference of 0.36%), and Cheyenne (74.8%, a difference of 0.40%).
| Demographics | Rating | Rank | In Labor Force | Age 20-64 |
| Inupiat | 0.0 /100 | #319 | Tragic 76.1% |
| Yakama | 0.0 /100 | #320 | Tragic 75.8% |
| Seminole | 0.0 /100 | #321 | Tragic 75.5% |
| Dutch West Indians | 0.0 /100 | #322 | Tragic 75.5% |
| Cajuns | 0.0 /100 | #323 | Tragic 75.5% |
| Choctaw | 0.0 /100 | #324 | Tragic 75.4% |
| Menominee | 0.0 /100 | #325 | Tragic 75.3% |
| Creek | 0.0 /100 | #326 | Tragic 75.1% |
| Sioux | 0.0 /100 | #327 | Tragic 75.0% |
| Kiowa | 0.0 /100 | #328 | Tragic 75.0% |
| Cheyenne | 0.0 /100 | #329 | Tragic 74.8% |
| Colville | 0.0 /100 | #330 | Tragic 74.8% |
| Paiute | 0.0 /100 | #331 | Tragic 74.7% |
| Arapaho | 0.0 /100 | #332 | Tragic 74.4% |
| Natives/Alaskans | 0.0 /100 | #333 | Tragic 73.9% |