Immigrants from Dominican Republic vs Belizean In Labor Force | Age 20-64
COMPARE
Immigrants from Dominican Republic
Belizean
In Labor Force | Age 20-64
In Labor Force | Age 20-64 Comparison
Immigrants from Dominican Republic
Belizeans
77.7%
IN LABOR FORCE | AGE 20-64
0.0/ 100
METRIC RATING
296th/ 347
METRIC RANK
78.2%
IN LABOR FORCE | AGE 20-64
0.0/ 100
METRIC RATING
279th/ 347
METRIC RANK
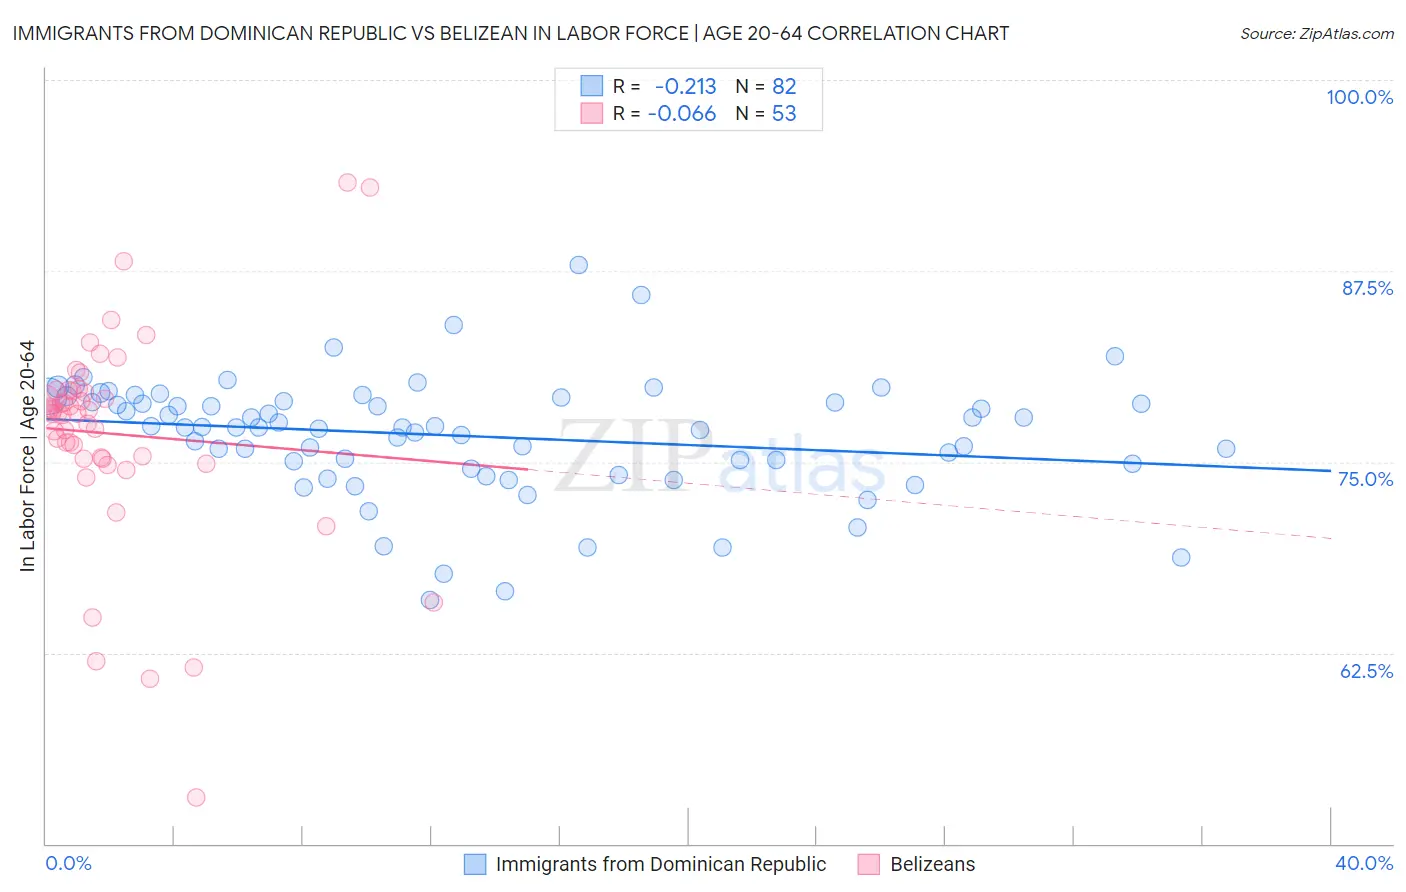
Immigrants from Dominican Republic vs Belizean In Labor Force | Age 20-64 Correlation Chart
The statistical analysis conducted on geographies consisting of 275,134,528 people shows a weak negative correlation between the proportion of Immigrants from Dominican Republic and labor force participation rate among population between the ages 20 and 64 in the United States with a correlation coefficient (R) of -0.213 and weighted average of 77.7%. Similarly, the statistical analysis conducted on geographies consisting of 144,213,246 people shows a slight negative correlation between the proportion of Belizeans and labor force participation rate among population between the ages 20 and 64 in the United States with a correlation coefficient (R) of -0.066 and weighted average of 78.2%, a difference of 0.63%.
In Labor Force | Age 20-64 Correlation Summary
| Measurement | Immigrants from Dominican Republic | Belizean |
| Minimum | 65.9% | 53.0% |
| Maximum | 87.8% | 93.3% |
| Range | 21.9% | 40.3% |
| Mean | 76.7% | 76.8% |
| Median | 77.3% | 78.2% |
| Interquartile 25% (IQ1) | 74.9% | 75.2% |
| Interquartile 75% (IQ3) | 79.0% | 79.7% |
| Interquartile Range (IQR) | 4.1% | 4.5% |
| Standard Deviation (Sample) | 3.9% | 7.1% |
| Standard Deviation (Population) | 3.9% | 7.0% |
Demographics Similar to Immigrants from Dominican Republic and Belizeans by In Labor Force | Age 20-64
In terms of in labor force | age 20-64, the demographic groups most similar to Immigrants from Dominican Republic are Dominican (77.7%, a difference of 0.010%), Immigrants from Grenada (77.7%, a difference of 0.030%), Immigrants from Central America (77.7%, a difference of 0.070%), Delaware (77.8%, a difference of 0.16%), and Immigrants from the Azores (77.8%, a difference of 0.19%). Similarly, the demographic groups most similar to Belizeans are Immigrants from Dominica (78.1%, a difference of 0.040%), Mexican American Indian (78.2%, a difference of 0.050%), Immigrants from Bahamas (78.2%, a difference of 0.060%), Guyanese (78.1%, a difference of 0.070%), and Immigrants from St. Vincent and the Grenadines (78.1%, a difference of 0.090%).
| Demographics | Rating | Rank | In Labor Force | Age 20-64 |
| Immigrants | Bahamas | 0.0 /100 | #277 | Tragic 78.2% |
| Mexican American Indians | 0.0 /100 | #278 | Tragic 78.2% |
| Belizeans | 0.0 /100 | #279 | Tragic 78.2% |
| Immigrants | Dominica | 0.0 /100 | #280 | Tragic 78.1% |
| Guyanese | 0.0 /100 | #281 | Tragic 78.1% |
| Immigrants | St. Vincent and the Grenadines | 0.0 /100 | #282 | Tragic 78.1% |
| Immigrants | Nonimmigrants | 0.0 /100 | #283 | Tragic 78.1% |
| Immigrants | Guyana | 0.0 /100 | #284 | Tragic 78.1% |
| Osage | 0.0 /100 | #285 | Tragic 78.0% |
| Immigrants | Belize | 0.0 /100 | #286 | Tragic 78.0% |
| Vietnamese | 0.0 /100 | #287 | Tragic 78.0% |
| Hmong | 0.0 /100 | #288 | Tragic 77.9% |
| Africans | 0.0 /100 | #289 | Tragic 77.9% |
| Immigrants | Bangladesh | 0.0 /100 | #290 | Tragic 77.9% |
| Spanish Americans | 0.0 /100 | #291 | Tragic 77.8% |
| Immigrants | Azores | 0.0 /100 | #292 | Tragic 77.8% |
| Delaware | 0.0 /100 | #293 | Tragic 77.8% |
| Immigrants | Central America | 0.0 /100 | #294 | Tragic 77.7% |
| Immigrants | Grenada | 0.0 /100 | #295 | Tragic 77.7% |
| Immigrants | Dominican Republic | 0.0 /100 | #296 | Tragic 77.7% |
| Dominicans | 0.0 /100 | #297 | Tragic 77.7% |