Finnish vs Slavic Female Poverty Among 25-34 Year Olds
COMPARE
Finnish
Slavic
Female Poverty Among 25-34 Year Olds
Female Poverty Among 25-34 Year Olds Comparison
Finns
Slavs
13.7%
FEMALE POVERTY AMONG 25-34 YEAR OLDS
32.5/ 100
METRIC RATING
189th/ 347
METRIC RANK
13.2%
FEMALE POVERTY AMONG 25-34 YEAR OLDS
75.7/ 100
METRIC RATING
152nd/ 347
METRIC RANK
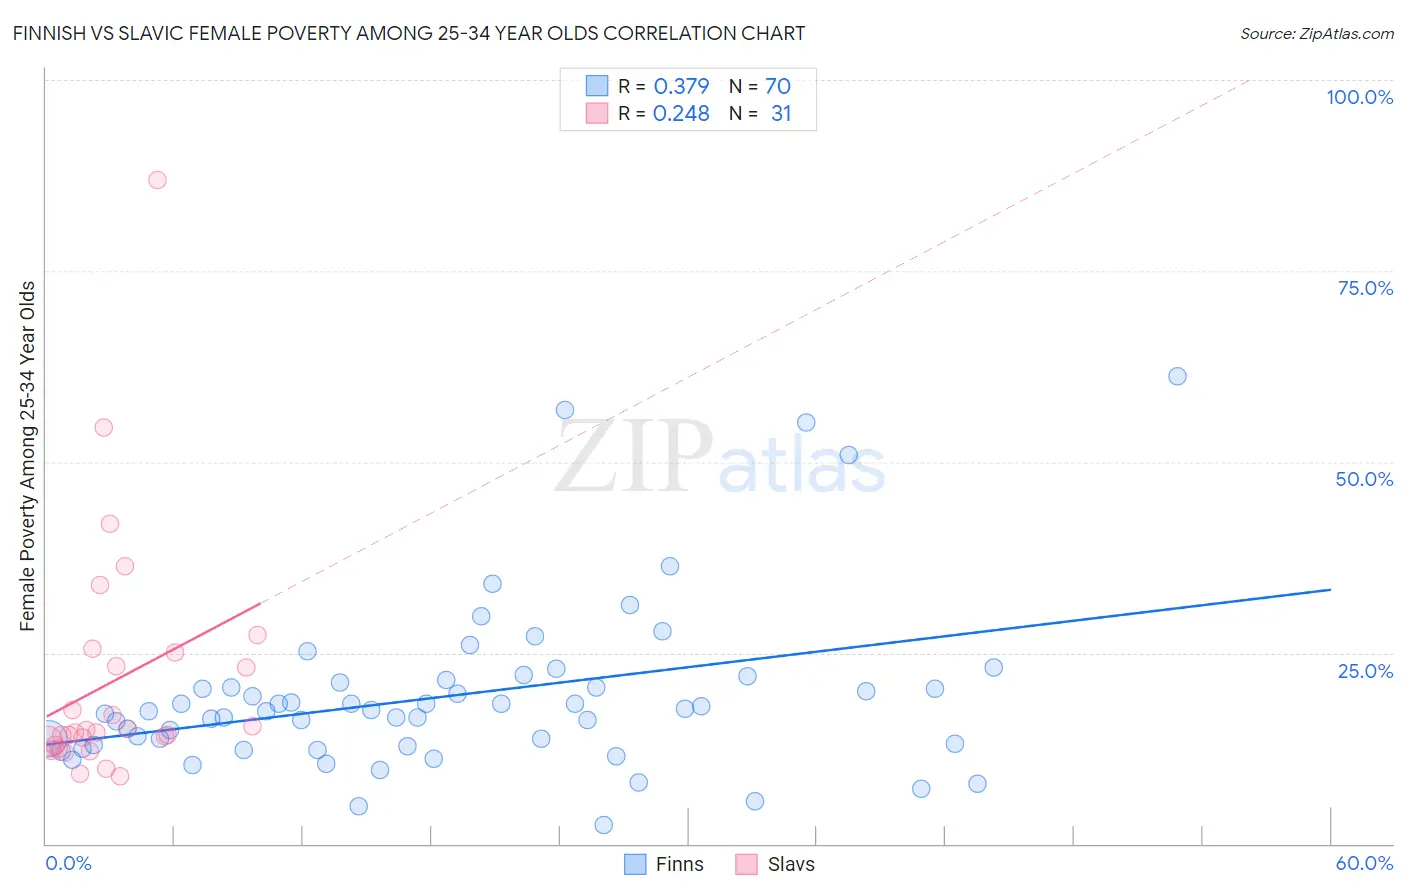
Finnish vs Slavic Female Poverty Among 25-34 Year Olds Correlation Chart
The statistical analysis conducted on geographies consisting of 396,136,684 people shows a mild positive correlation between the proportion of Finns and poverty level among females between the ages 25 and 34 in the United States with a correlation coefficient (R) of 0.379 and weighted average of 13.7%. Similarly, the statistical analysis conducted on geographies consisting of 266,820,007 people shows a weak positive correlation between the proportion of Slavs and poverty level among females between the ages 25 and 34 in the United States with a correlation coefficient (R) of 0.248 and weighted average of 13.2%, a difference of 4.0%.
Female Poverty Among 25-34 Year Olds Correlation Summary
| Measurement | Finnish | Slavic |
| Minimum | 2.4% | 8.9% |
| Maximum | 61.2% | 87.0% |
| Range | 58.8% | 78.1% |
| Mean | 19.4% | 21.3% |
| Median | 17.4% | 14.5% |
| Interquartile 25% (IQ1) | 12.9% | 12.9% |
| Interquartile 75% (IQ3) | 21.1% | 25.0% |
| Interquartile Range (IQR) | 8.2% | 12.1% |
| Standard Deviation (Sample) | 11.1% | 16.0% |
| Standard Deviation (Population) | 11.1% | 15.8% |
Similar Demographics by Female Poverty Among 25-34 Year Olds
Demographics Similar to Finns by Female Poverty Among 25-34 Year Olds
In terms of female poverty among 25-34 year olds, the demographic groups most similar to Finns are Immigrants from Eritrea (13.7%, a difference of 0.020%), Immigrants from Uruguay (13.7%, a difference of 0.15%), Slovak (13.7%, a difference of 0.15%), Irish (13.7%, a difference of 0.26%), and Dutch (13.8%, a difference of 0.26%).
| Demographics | Rating | Rank | Female Poverty Among 25-34 Year Olds |
| Immigrants | Venezuela | 40.7 /100 | #182 | Average 13.6% |
| Portuguese | 40.3 /100 | #183 | Average 13.6% |
| Czechoslovakians | 36.8 /100 | #184 | Fair 13.7% |
| Irish | 35.3 /100 | #185 | Fair 13.7% |
| Immigrants | Uruguay | 34.1 /100 | #186 | Fair 13.7% |
| Slovaks | 34.1 /100 | #187 | Fair 13.7% |
| Immigrants | Eritrea | 32.7 /100 | #188 | Fair 13.7% |
| Finns | 32.5 /100 | #189 | Fair 13.7% |
| Dutch | 29.7 /100 | #190 | Fair 13.8% |
| Immigrants | St. Vincent and the Grenadines | 29.3 /100 | #191 | Fair 13.8% |
| Tlingit-Haida | 28.1 /100 | #192 | Fair 13.8% |
| Immigrants | Kenya | 28.0 /100 | #193 | Fair 13.8% |
| Moroccans | 25.1 /100 | #194 | Fair 13.8% |
| Immigrants | Cambodia | 24.0 /100 | #195 | Fair 13.9% |
| Scottish | 23.6 /100 | #196 | Fair 13.9% |
Demographics Similar to Slavs by Female Poverty Among 25-34 Year Olds
In terms of female poverty among 25-34 year olds, the demographic groups most similar to Slavs are Costa Rican (13.2%, a difference of 0.010%), Iraqi (13.2%, a difference of 0.040%), Sierra Leonean (13.2%, a difference of 0.060%), European (13.2%, a difference of 0.13%), and Lebanese (13.2%, a difference of 0.13%).
| Demographics | Rating | Rank | Female Poverty Among 25-34 Year Olds |
| Colombians | 77.2 /100 | #145 | Good 13.2% |
| South Americans | 76.9 /100 | #146 | Good 13.2% |
| Europeans | 76.8 /100 | #147 | Good 13.2% |
| Lebanese | 76.8 /100 | #148 | Good 13.2% |
| Sierra Leoneans | 76.3 /100 | #149 | Good 13.2% |
| Iraqis | 76.0 /100 | #150 | Good 13.2% |
| Costa Ricans | 75.8 /100 | #151 | Good 13.2% |
| Slavs | 75.7 /100 | #152 | Good 13.2% |
| Northern Europeans | 73.7 /100 | #153 | Good 13.2% |
| Arabs | 73.5 /100 | #154 | Good 13.2% |
| Immigrants | Sierra Leone | 72.9 /100 | #155 | Good 13.3% |
| Immigrants | Cameroon | 72.0 /100 | #156 | Good 13.3% |
| Immigrants | Western Europe | 70.3 /100 | #157 | Good 13.3% |
| Immigrants | Colombia | 69.2 /100 | #158 | Good 13.3% |
| Uruguayans | 66.9 /100 | #159 | Good 13.3% |