Finnish vs Shoshone In Labor Force | Age 20-64
COMPARE
Finnish
Shoshone
In Labor Force | Age 20-64
In Labor Force | Age 20-64 Comparison
Finns
Shoshone
79.5%
IN LABOR FORCE | AGE 20-64
35.9/ 100
METRIC RATING
184th/ 347
METRIC RANK
76.8%
IN LABOR FORCE | AGE 20-64
0.0/ 100
METRIC RATING
313th/ 347
METRIC RANK
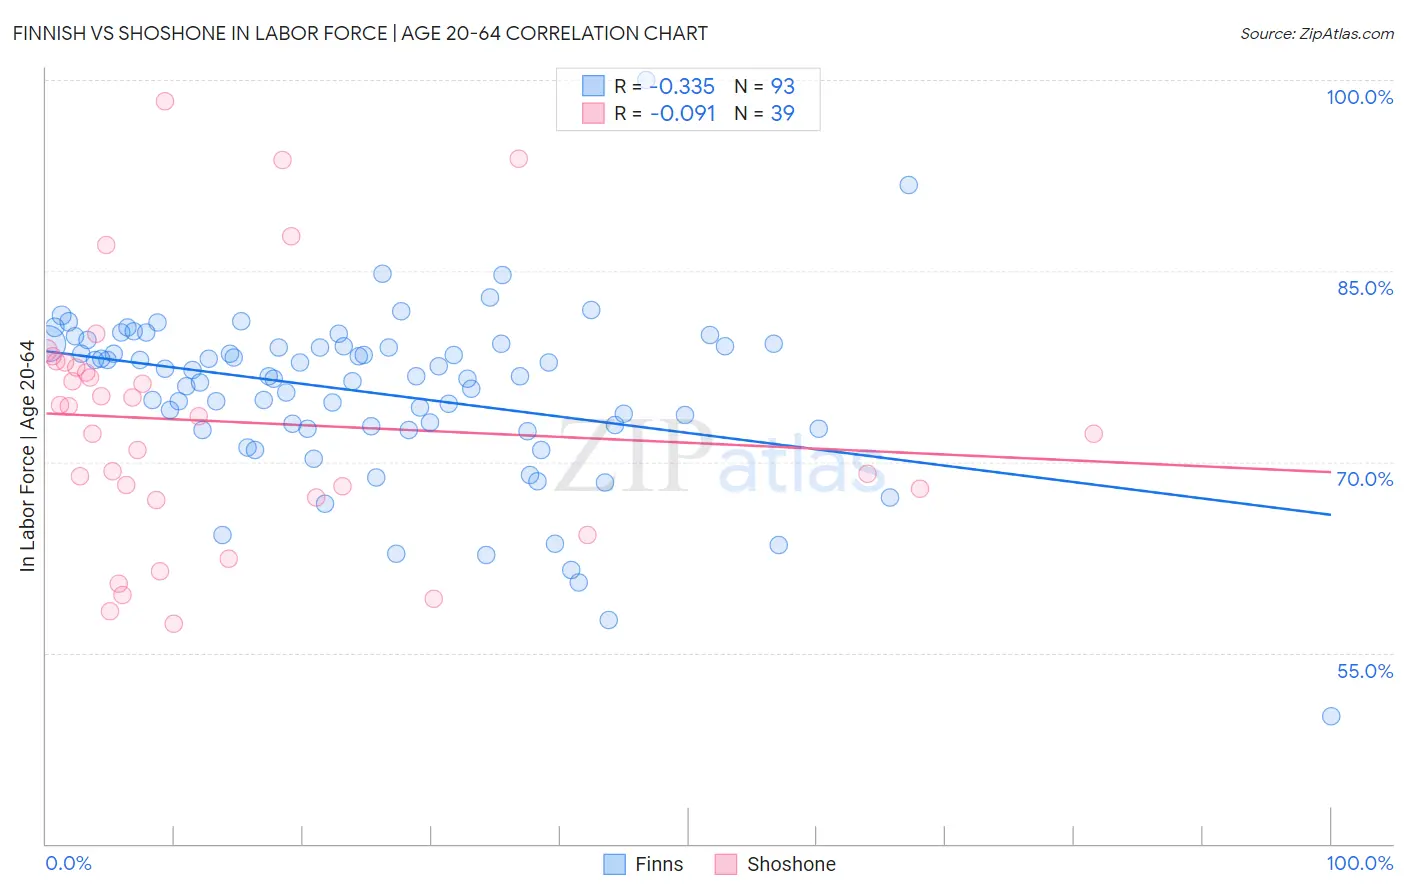
Finnish vs Shoshone In Labor Force | Age 20-64 Correlation Chart
The statistical analysis conducted on geographies consisting of 404,683,830 people shows a mild negative correlation between the proportion of Finns and labor force participation rate among population between the ages 20 and 64 in the United States with a correlation coefficient (R) of -0.335 and weighted average of 79.5%. Similarly, the statistical analysis conducted on geographies consisting of 66,627,303 people shows a slight negative correlation between the proportion of Shoshone and labor force participation rate among population between the ages 20 and 64 in the United States with a correlation coefficient (R) of -0.091 and weighted average of 76.8%, a difference of 3.5%.
In Labor Force | Age 20-64 Correlation Summary
| Measurement | Finnish | Shoshone |
| Minimum | 50.0% | 57.3% |
| Maximum | 100.0% | 98.3% |
| Range | 50.0% | 41.0% |
| Mean | 75.4% | 73.2% |
| Median | 76.7% | 73.6% |
| Interquartile 25% (IQ1) | 72.6% | 67.2% |
| Interquartile 75% (IQ3) | 79.2% | 77.8% |
| Interquartile Range (IQR) | 6.5% | 10.6% |
| Standard Deviation (Sample) | 6.9% | 9.8% |
| Standard Deviation (Population) | 6.8% | 9.7% |
Similar Demographics by In Labor Force | Age 20-64
Demographics Similar to Finns by In Labor Force | Age 20-64
In terms of in labor force | age 20-64, the demographic groups most similar to Finns are Malaysian (79.5%, a difference of 0.010%), Immigrants from Hungary (79.5%, a difference of 0.010%), Israeli (79.5%, a difference of 0.010%), Northern European (79.5%, a difference of 0.010%), and Immigrants from Saudi Arabia (79.5%, a difference of 0.020%).
| Demographics | Rating | Rank | In Labor Force | Age 20-64 |
| Immigrants | Netherlands | 45.2 /100 | #177 | Average 79.5% |
| Czechoslovakians | 44.3 /100 | #178 | Average 79.5% |
| Armenians | 41.4 /100 | #179 | Average 79.5% |
| Salvadorans | 41.0 /100 | #180 | Average 79.5% |
| Immigrants | Saudi Arabia | 37.7 /100 | #181 | Fair 79.5% |
| Malaysians | 37.1 /100 | #182 | Fair 79.5% |
| Immigrants | Hungary | 36.8 /100 | #183 | Fair 79.5% |
| Finns | 35.9 /100 | #184 | Fair 79.5% |
| Israelis | 34.7 /100 | #185 | Fair 79.5% |
| Northern Europeans | 34.5 /100 | #186 | Fair 79.5% |
| Assyrians/Chaldeans/Syriacs | 33.3 /100 | #187 | Fair 79.4% |
| Immigrants | Haiti | 32.1 /100 | #188 | Fair 79.4% |
| Immigrants | El Salvador | 30.9 /100 | #189 | Fair 79.4% |
| Immigrants | Syria | 30.8 /100 | #190 | Fair 79.4% |
| Swiss | 28.9 /100 | #191 | Fair 79.4% |
Demographics Similar to Shoshone by In Labor Force | Age 20-64
In terms of in labor force | age 20-64, the demographic groups most similar to Shoshone are Black/African American (76.8%, a difference of 0.020%), Alaskan Athabascan (76.9%, a difference of 0.12%), Ottawa (76.7%, a difference of 0.12%), Blackfeet (77.0%, a difference of 0.29%), and Yaqui (76.5%, a difference of 0.31%).
| Demographics | Rating | Rank | In Labor Force | Age 20-64 |
| Potawatomi | 0.0 /100 | #306 | Tragic 77.2% |
| Central American Indians | 0.0 /100 | #307 | Tragic 77.1% |
| Alaska Natives | 0.0 /100 | #308 | Tragic 77.0% |
| Americans | 0.0 /100 | #309 | Tragic 77.0% |
| Comanche | 0.0 /100 | #310 | Tragic 77.0% |
| Blackfeet | 0.0 /100 | #311 | Tragic 77.0% |
| Alaskan Athabascans | 0.0 /100 | #312 | Tragic 76.9% |
| Shoshone | 0.0 /100 | #313 | Tragic 76.8% |
| Blacks/African Americans | 0.0 /100 | #314 | Tragic 76.8% |
| Ottawa | 0.0 /100 | #315 | Tragic 76.7% |
| Yaqui | 0.0 /100 | #316 | Tragic 76.5% |
| Cherokee | 0.0 /100 | #317 | Tragic 76.2% |
| Chickasaw | 0.0 /100 | #318 | Tragic 76.2% |
| Inupiat | 0.0 /100 | #319 | Tragic 76.1% |
| Yakama | 0.0 /100 | #320 | Tragic 75.8% |