Finnish vs Serbian In Labor Force | Age 20-24
COMPARE
Finnish
Serbian
In Labor Force | Age 20-24
In Labor Force | Age 20-24 Comparison
Finns
Serbians
78.7%
IN LABOR FORCE | AGE 20-24
100.0/ 100
METRIC RATING
11th/ 347
METRIC RANK
77.3%
IN LABOR FORCE | AGE 20-24
100.0/ 100
METRIC RATING
48th/ 347
METRIC RANK
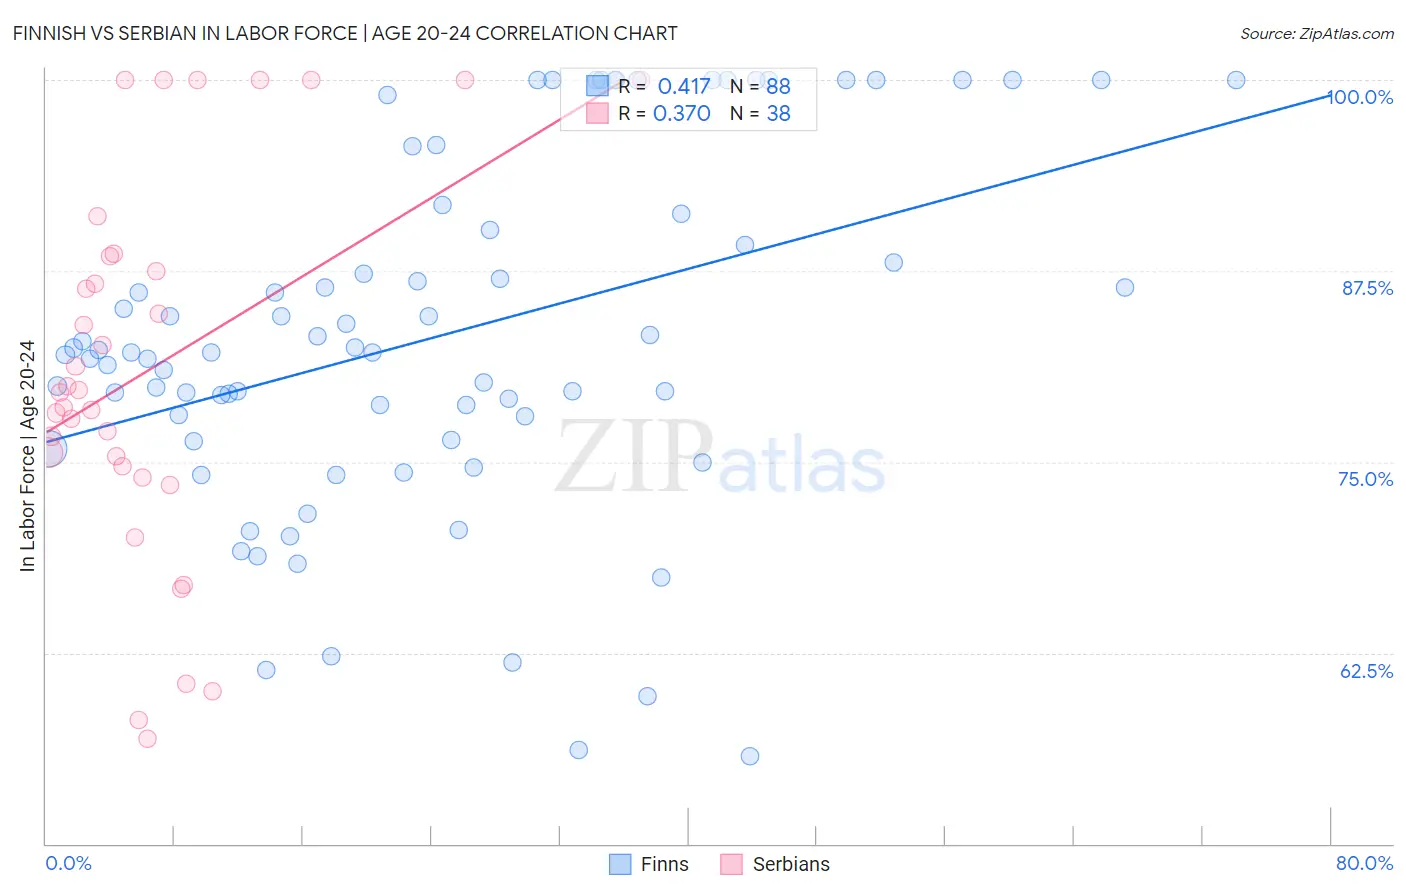
Finnish vs Serbian In Labor Force | Age 20-24 Correlation Chart
The statistical analysis conducted on geographies consisting of 404,336,284 people shows a moderate positive correlation between the proportion of Finns and labor force participation rate among population between the ages 20 and 24 in the United States with a correlation coefficient (R) of 0.417 and weighted average of 78.7%. Similarly, the statistical analysis conducted on geographies consisting of 267,532,940 people shows a mild positive correlation between the proportion of Serbians and labor force participation rate among population between the ages 20 and 24 in the United States with a correlation coefficient (R) of 0.370 and weighted average of 77.3%, a difference of 1.8%.
In Labor Force | Age 20-24 Correlation Summary
| Measurement | Finnish | Serbian |
| Minimum | 55.7% | 56.9% |
| Maximum | 100.0% | 100.0% |
| Range | 44.3% | 43.1% |
| Mean | 83.2% | 81.0% |
| Median | 82.2% | 79.6% |
| Interquartile 25% (IQ1) | 77.2% | 74.7% |
| Interquartile 75% (IQ3) | 90.7% | 88.5% |
| Interquartile Range (IQR) | 13.5% | 13.7% |
| Standard Deviation (Sample) | 11.4% | 12.3% |
| Standard Deviation (Population) | 11.4% | 12.2% |
Similar Demographics by In Labor Force | Age 20-24
Demographics Similar to Finns by In Labor Force | Age 20-24
In terms of in labor force | age 20-24, the demographic groups most similar to Finns are Slovene (78.7%, a difference of 0.040%), German (78.6%, a difference of 0.11%), Scandinavian (78.5%, a difference of 0.18%), Swedish (78.8%, a difference of 0.19%), and Czech (78.5%, a difference of 0.19%).
| Demographics | Rating | Rank | In Labor Force | Age 20-24 |
| Alaskan Athabascans | 100.0 /100 | #4 | Exceptional 79.1% |
| Aleuts | 100.0 /100 | #5 | Exceptional 79.0% |
| Danes | 100.0 /100 | #6 | Exceptional 79.0% |
| Luxembourgers | 100.0 /100 | #7 | Exceptional 79.0% |
| Immigrants | Cabo Verde | 100.0 /100 | #8 | Exceptional 78.9% |
| Swedes | 100.0 /100 | #9 | Exceptional 78.8% |
| Slovenes | 100.0 /100 | #10 | Exceptional 78.7% |
| Finns | 100.0 /100 | #11 | Exceptional 78.7% |
| Germans | 100.0 /100 | #12 | Exceptional 78.6% |
| Scandinavians | 100.0 /100 | #13 | Exceptional 78.5% |
| Czechs | 100.0 /100 | #14 | Exceptional 78.5% |
| Sudanese | 100.0 /100 | #15 | Exceptional 78.4% |
| Dutch | 100.0 /100 | #16 | Exceptional 78.4% |
| Cape Verdeans | 100.0 /100 | #17 | Exceptional 78.3% |
| Immigrants | Bosnia and Herzegovina | 100.0 /100 | #18 | Exceptional 78.1% |
Demographics Similar to Serbians by In Labor Force | Age 20-24
In terms of in labor force | age 20-24, the demographic groups most similar to Serbians are Chinese (77.3%, a difference of 0.010%), Ethiopian (77.3%, a difference of 0.050%), Malaysian (77.2%, a difference of 0.050%), Croatian (77.2%, a difference of 0.060%), and Indonesian (77.2%, a difference of 0.060%).
| Demographics | Rating | Rank | In Labor Force | Age 20-24 |
| Immigrants | Congo | 100.0 /100 | #41 | Exceptional 77.4% |
| French | 100.0 /100 | #42 | Exceptional 77.4% |
| Immigrants | Laos | 100.0 /100 | #43 | Exceptional 77.4% |
| Fijians | 100.0 /100 | #44 | Exceptional 77.4% |
| Native Hawaiians | 100.0 /100 | #45 | Exceptional 77.4% |
| Samoans | 100.0 /100 | #46 | Exceptional 77.4% |
| Ethiopians | 100.0 /100 | #47 | Exceptional 77.3% |
| Serbians | 100.0 /100 | #48 | Exceptional 77.3% |
| Chinese | 100.0 /100 | #49 | Exceptional 77.3% |
| Malaysians | 100.0 /100 | #50 | Exceptional 77.2% |
| Croatians | 100.0 /100 | #51 | Exceptional 77.2% |
| Indonesians | 100.0 /100 | #52 | Exceptional 77.2% |
| Immigrants | Azores | 100.0 /100 | #53 | Exceptional 77.2% |
| Celtics | 99.9 /100 | #54 | Exceptional 77.1% |
| Immigrants | Liberia | 99.9 /100 | #55 | Exceptional 77.1% |