Finnish vs Potawatomi In Labor Force | Age 16-19
COMPARE
Finnish
Potawatomi
In Labor Force | Age 16-19
In Labor Force | Age 16-19 Comparison
Finns
Potawatomi
43.9%
IN LABOR FORCE | AGE 16-19
100.0/ 100
METRIC RATING
12th/ 347
METRIC RANK
40.0%
IN LABOR FORCE | AGE 16-19
99.9/ 100
METRIC RATING
69th/ 347
METRIC RANK
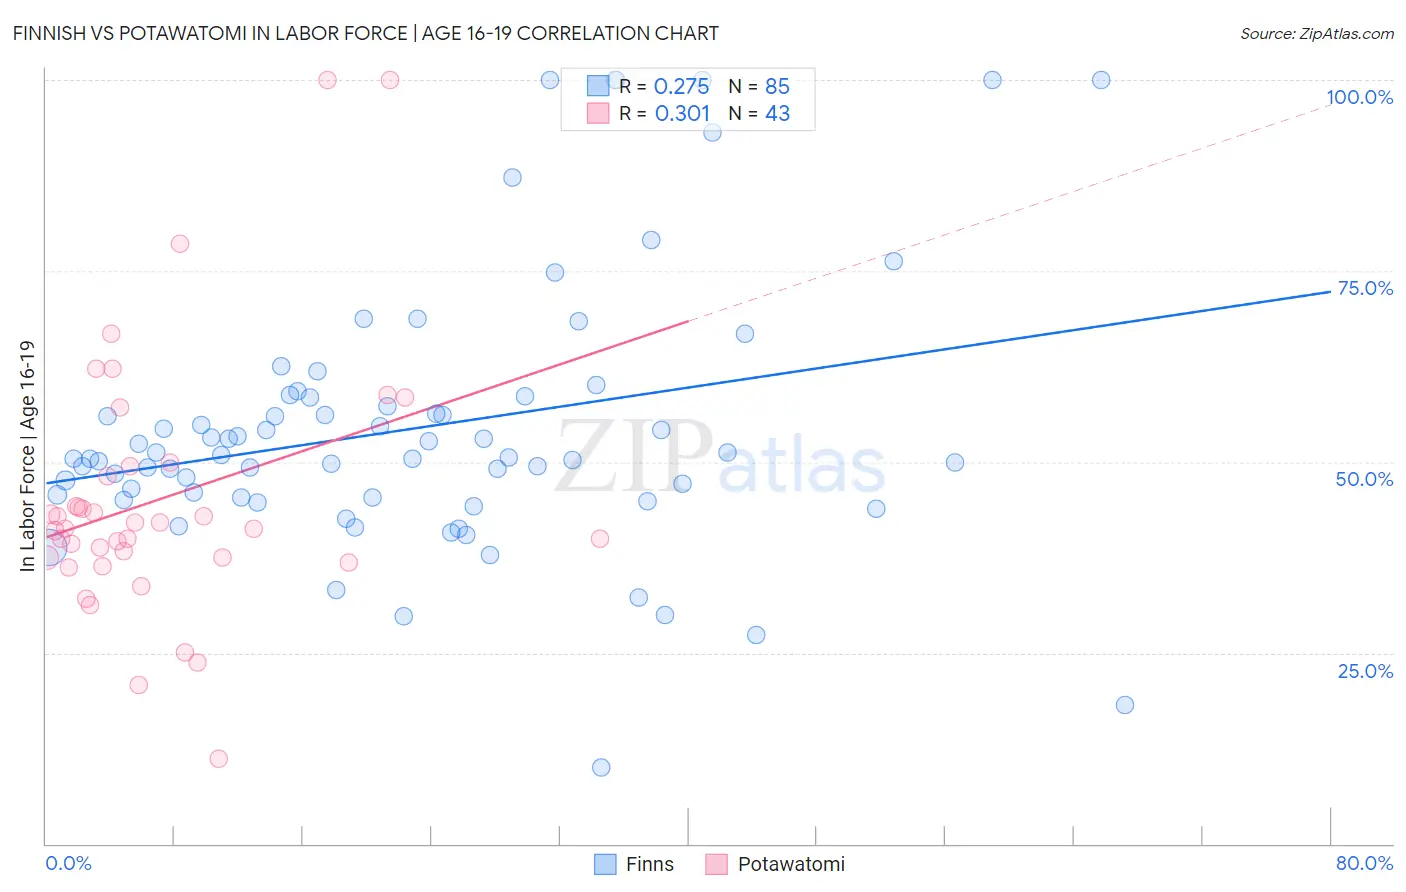
Finnish vs Potawatomi In Labor Force | Age 16-19 Correlation Chart
The statistical analysis conducted on geographies consisting of 403,764,919 people shows a weak positive correlation between the proportion of Finns and labor force participation rate among population between the ages 16 and 19 in the United States with a correlation coefficient (R) of 0.275 and weighted average of 43.9%. Similarly, the statistical analysis conducted on geographies consisting of 117,698,068 people shows a mild positive correlation between the proportion of Potawatomi and labor force participation rate among population between the ages 16 and 19 in the United States with a correlation coefficient (R) of 0.301 and weighted average of 40.0%, a difference of 9.7%.
In Labor Force | Age 16-19 Correlation Summary
| Measurement | Finnish | Potawatomi |
| Minimum | 10.0% | 11.1% |
| Maximum | 100.0% | 100.0% |
| Range | 90.0% | 88.9% |
| Mean | 54.5% | 45.1% |
| Median | 50.6% | 41.3% |
| Interquartile 25% (IQ1) | 45.4% | 37.4% |
| Interquartile 75% (IQ3) | 58.5% | 49.5% |
| Interquartile Range (IQR) | 13.1% | 12.1% |
| Standard Deviation (Sample) | 17.8% | 17.3% |
| Standard Deviation (Population) | 17.7% | 17.1% |
Similar Demographics by In Labor Force | Age 16-19
Demographics Similar to Finns by In Labor Force | Age 16-19
In terms of in labor force | age 16-19, the demographic groups most similar to Finns are Dutch (43.8%, a difference of 0.19%), Chippewa (43.8%, a difference of 0.29%), Swedish (44.1%, a difference of 0.46%), German (44.2%, a difference of 0.54%), and Slovene (43.7%, a difference of 0.55%).
| Demographics | Rating | Rank | In Labor Force | Age 16-19 |
| Alaskan Athabascans | 100.0 /100 | #5 | Exceptional 45.2% |
| Somalis | 100.0 /100 | #6 | Exceptional 45.1% |
| Danes | 100.0 /100 | #7 | Exceptional 44.7% |
| Immigrants | Cabo Verde | 100.0 /100 | #8 | Exceptional 44.7% |
| Cape Verdeans | 100.0 /100 | #9 | Exceptional 44.5% |
| Germans | 100.0 /100 | #10 | Exceptional 44.2% |
| Swedes | 100.0 /100 | #11 | Exceptional 44.1% |
| Finns | 100.0 /100 | #12 | Exceptional 43.9% |
| Dutch | 100.0 /100 | #13 | Exceptional 43.8% |
| Chippewa | 100.0 /100 | #14 | Exceptional 43.8% |
| Slovenes | 100.0 /100 | #15 | Exceptional 43.7% |
| Czechs | 100.0 /100 | #16 | Exceptional 43.6% |
| Scandinavians | 100.0 /100 | #17 | Exceptional 43.6% |
| French Canadians | 100.0 /100 | #18 | Exceptional 43.6% |
| Belgians | 100.0 /100 | #19 | Exceptional 43.4% |
Demographics Similar to Potawatomi by In Labor Force | Age 16-19
In terms of in labor force | age 16-19, the demographic groups most similar to Potawatomi are Portuguese (40.0%, a difference of 0.050%), Italian (40.1%, a difference of 0.070%), Canadian (40.1%, a difference of 0.13%), Nonimmigrants (40.1%, a difference of 0.14%), and Serbian (39.9%, a difference of 0.22%).
| Demographics | Rating | Rank | In Labor Force | Age 16-19 |
| Cherokee | 100.0 /100 | #62 | Exceptional 40.2% |
| Northern Europeans | 100.0 /100 | #63 | Exceptional 40.2% |
| Immigrants | Micronesia | 100.0 /100 | #64 | Exceptional 40.2% |
| Kenyans | 100.0 /100 | #65 | Exceptional 40.1% |
| Immigrants | Nonimmigrants | 100.0 /100 | #66 | Exceptional 40.1% |
| Canadians | 100.0 /100 | #67 | Exceptional 40.1% |
| Italians | 99.9 /100 | #68 | Exceptional 40.1% |
| Potawatomi | 99.9 /100 | #69 | Exceptional 40.0% |
| Portuguese | 99.9 /100 | #70 | Exceptional 40.0% |
| Serbians | 99.9 /100 | #71 | Exceptional 39.9% |
| Iroquois | 99.9 /100 | #72 | Exceptional 39.9% |
| Immigrants | Middle Africa | 99.9 /100 | #73 | Exceptional 39.9% |
| Hungarians | 99.9 /100 | #74 | Exceptional 39.8% |
| French American Indians | 99.9 /100 | #75 | Exceptional 39.8% |
| Malaysians | 99.9 /100 | #76 | Exceptional 39.7% |