Finnish vs Honduran In Labor Force | Age 20-24
COMPARE
Finnish
Honduran
In Labor Force | Age 20-24
In Labor Force | Age 20-24 Comparison
Finns
Hondurans
78.7%
IN LABOR FORCE | AGE 20-24
100.0/ 100
METRIC RATING
11th/ 347
METRIC RANK
74.8%
IN LABOR FORCE | AGE 20-24
32.7/ 100
METRIC RATING
188th/ 347
METRIC RANK
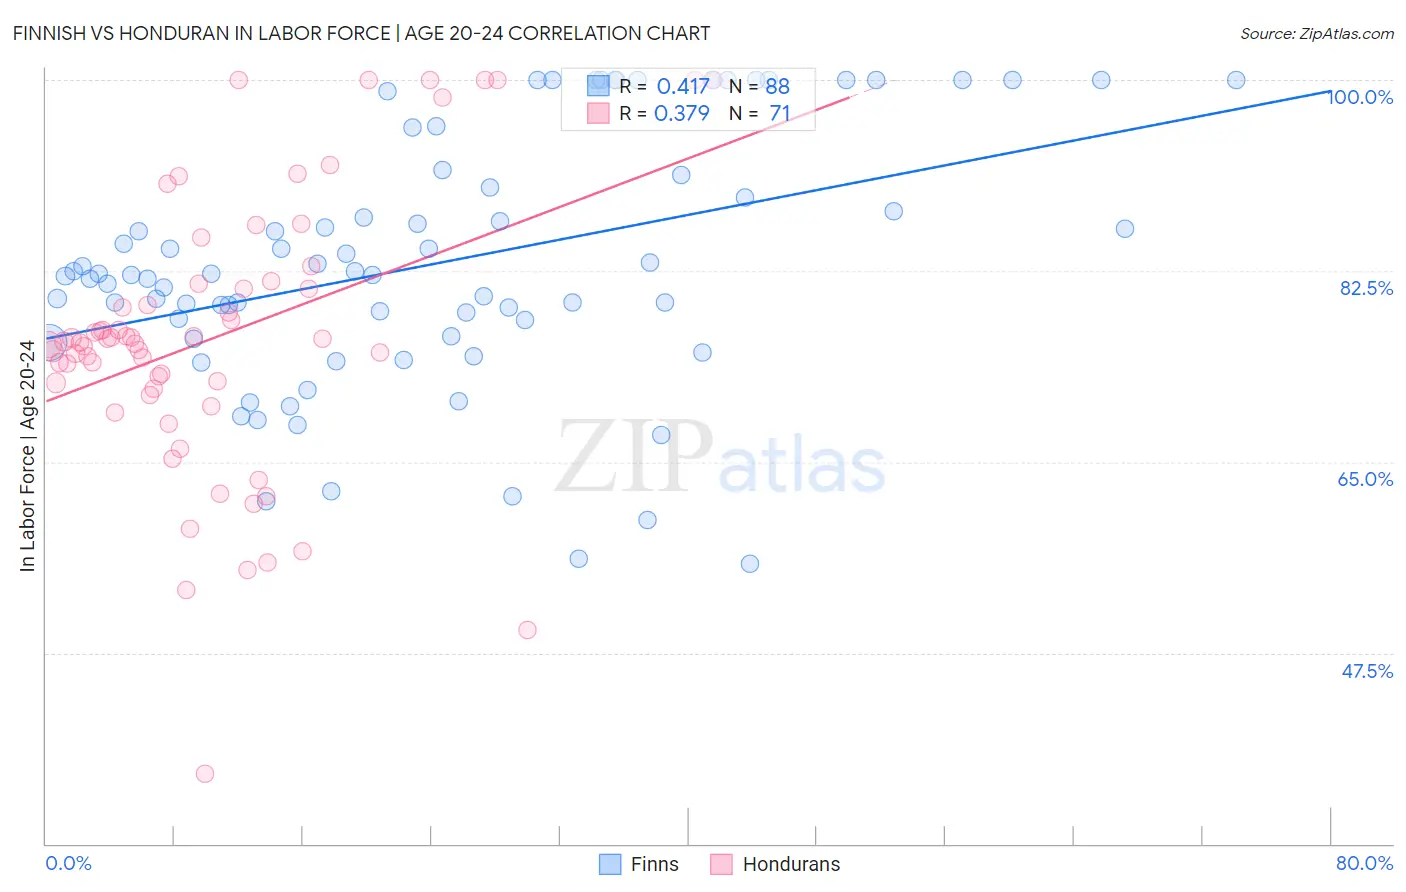
Finnish vs Honduran In Labor Force | Age 20-24 Correlation Chart
The statistical analysis conducted on geographies consisting of 404,336,284 people shows a moderate positive correlation between the proportion of Finns and labor force participation rate among population between the ages 20 and 24 in the United States with a correlation coefficient (R) of 0.417 and weighted average of 78.7%. Similarly, the statistical analysis conducted on geographies consisting of 357,783,133 people shows a mild positive correlation between the proportion of Hondurans and labor force participation rate among population between the ages 20 and 24 in the United States with a correlation coefficient (R) of 0.379 and weighted average of 74.8%, a difference of 5.1%.
In Labor Force | Age 20-24 Correlation Summary
| Measurement | Finnish | Honduran |
| Minimum | 55.7% | 36.4% |
| Maximum | 100.0% | 100.0% |
| Range | 44.3% | 63.6% |
| Mean | 83.2% | 76.4% |
| Median | 82.2% | 76.1% |
| Interquartile 25% (IQ1) | 77.2% | 71.8% |
| Interquartile 75% (IQ3) | 90.7% | 81.3% |
| Interquartile Range (IQR) | 13.5% | 9.5% |
| Standard Deviation (Sample) | 11.4% | 12.8% |
| Standard Deviation (Population) | 11.4% | 12.7% |
Similar Demographics by In Labor Force | Age 20-24
Demographics Similar to Finns by In Labor Force | Age 20-24
In terms of in labor force | age 20-24, the demographic groups most similar to Finns are Slovene (78.7%, a difference of 0.040%), German (78.6%, a difference of 0.11%), Scandinavian (78.5%, a difference of 0.18%), Swedish (78.8%, a difference of 0.19%), and Czech (78.5%, a difference of 0.19%).
| Demographics | Rating | Rank | In Labor Force | Age 20-24 |
| Alaskan Athabascans | 100.0 /100 | #4 | Exceptional 79.1% |
| Aleuts | 100.0 /100 | #5 | Exceptional 79.0% |
| Danes | 100.0 /100 | #6 | Exceptional 79.0% |
| Luxembourgers | 100.0 /100 | #7 | Exceptional 79.0% |
| Immigrants | Cabo Verde | 100.0 /100 | #8 | Exceptional 78.9% |
| Swedes | 100.0 /100 | #9 | Exceptional 78.8% |
| Slovenes | 100.0 /100 | #10 | Exceptional 78.7% |
| Finns | 100.0 /100 | #11 | Exceptional 78.7% |
| Germans | 100.0 /100 | #12 | Exceptional 78.6% |
| Scandinavians | 100.0 /100 | #13 | Exceptional 78.5% |
| Czechs | 100.0 /100 | #14 | Exceptional 78.5% |
| Sudanese | 100.0 /100 | #15 | Exceptional 78.4% |
| Dutch | 100.0 /100 | #16 | Exceptional 78.4% |
| Cape Verdeans | 100.0 /100 | #17 | Exceptional 78.3% |
| Immigrants | Bosnia and Herzegovina | 100.0 /100 | #18 | Exceptional 78.1% |
Demographics Similar to Hondurans by In Labor Force | Age 20-24
In terms of in labor force | age 20-24, the demographic groups most similar to Hondurans are Immigrants from Northern Europe (74.8%, a difference of 0.0%), Immigrants from Honduras (74.9%, a difference of 0.010%), Russian (74.8%, a difference of 0.010%), Immigrants from Eastern Europe (74.9%, a difference of 0.020%), and Immigrants from Hungary (74.9%, a difference of 0.040%).
| Demographics | Rating | Rank | In Labor Force | Age 20-24 |
| Africans | 42.5 /100 | #181 | Average 75.0% |
| Immigrants | South Africa | 36.9 /100 | #182 | Fair 74.9% |
| Immigrants | Costa Rica | 36.7 /100 | #183 | Fair 74.9% |
| Immigrants | Hungary | 35.0 /100 | #184 | Fair 74.9% |
| Sri Lankans | 34.9 /100 | #185 | Fair 74.9% |
| Immigrants | Eastern Europe | 33.8 /100 | #186 | Fair 74.9% |
| Immigrants | Honduras | 33.5 /100 | #187 | Fair 74.9% |
| Hondurans | 32.7 /100 | #188 | Fair 74.8% |
| Immigrants | Northern Europe | 32.6 /100 | #189 | Fair 74.8% |
| Russians | 32.2 /100 | #190 | Fair 74.8% |
| Senegalese | 28.1 /100 | #191 | Fair 74.8% |
| Immigrants | Europe | 27.5 /100 | #192 | Fair 74.8% |
| Alsatians | 27.1 /100 | #193 | Fair 74.8% |
| Immigrants | Denmark | 25.8 /100 | #194 | Fair 74.8% |
| Eastern Europeans | 25.4 /100 | #195 | Fair 74.8% |