Finnish vs Immigrants from Barbados In Labor Force | Age 30-34
COMPARE
Finnish
Immigrants from Barbados
In Labor Force | Age 30-34
In Labor Force | Age 30-34 Comparison
Finns
Immigrants from Barbados
84.7%
IN LABOR FORCE | AGE 30-34
50.0/ 100
METRIC RATING
174th/ 347
METRIC RANK
84.0%
IN LABOR FORCE | AGE 30-34
1.4/ 100
METRIC RATING
238th/ 347
METRIC RANK
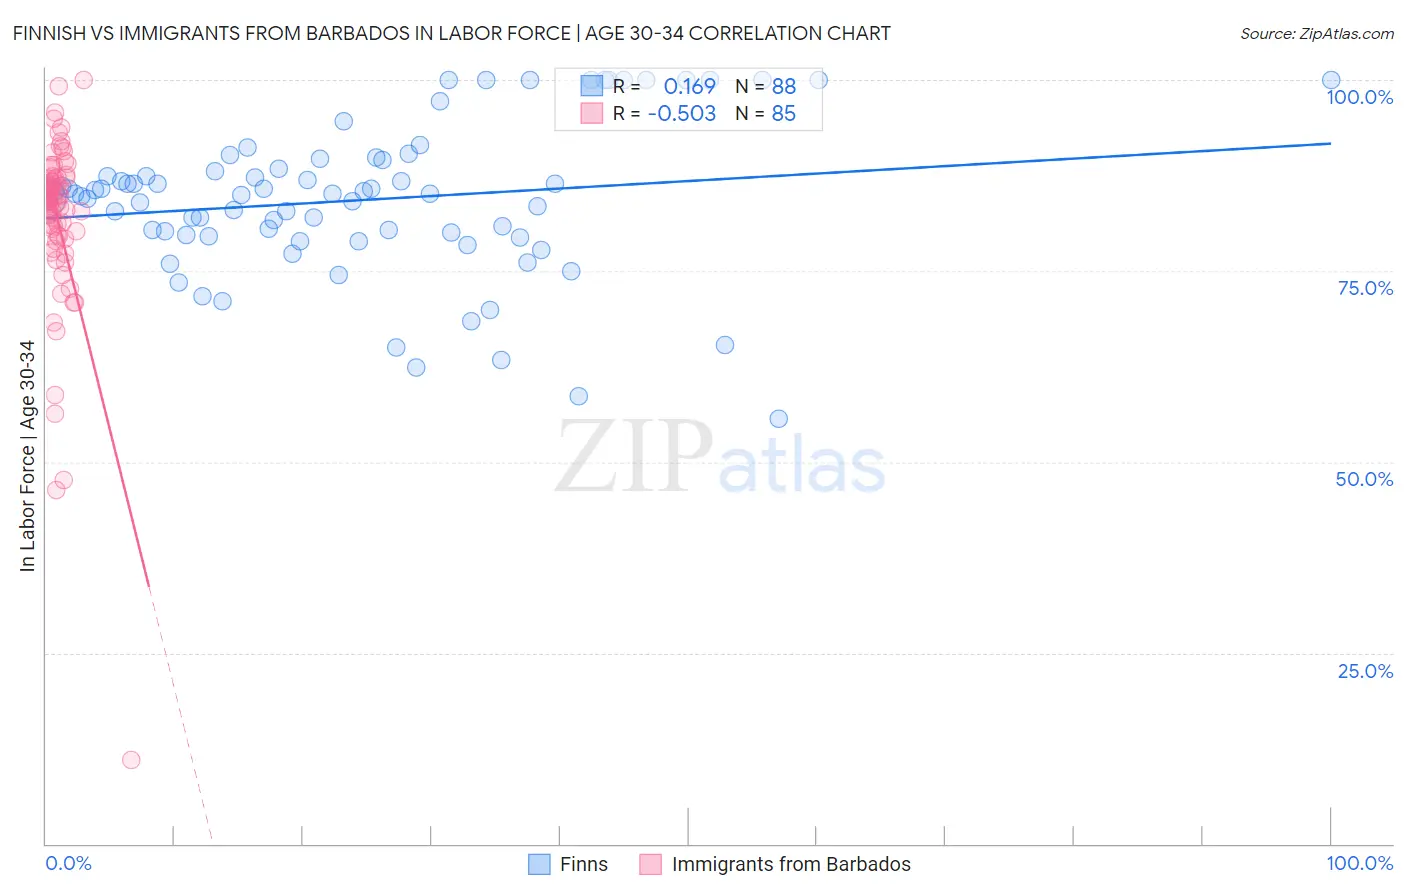
Finnish vs Immigrants from Barbados In Labor Force | Age 30-34 Correlation Chart
The statistical analysis conducted on geographies consisting of 404,404,222 people shows a poor positive correlation between the proportion of Finns and labor force participation rate among population between the ages 30 and 34 in the United States with a correlation coefficient (R) of 0.169 and weighted average of 84.7%. Similarly, the statistical analysis conducted on geographies consisting of 112,774,912 people shows a substantial negative correlation between the proportion of Immigrants from Barbados and labor force participation rate among population between the ages 30 and 34 in the United States with a correlation coefficient (R) of -0.503 and weighted average of 84.0%, a difference of 0.76%.
In Labor Force | Age 30-34 Correlation Summary
| Measurement | Finnish | Immigrants from Barbados |
| Minimum | 55.6% | 10.9% |
| Maximum | 100.0% | 100.0% |
| Range | 44.4% | 89.1% |
| Mean | 84.2% | 81.8% |
| Median | 85.1% | 84.6% |
| Interquartile 25% (IQ1) | 79.7% | 79.9% |
| Interquartile 75% (IQ3) | 88.9% | 87.0% |
| Interquartile Range (IQR) | 9.2% | 7.1% |
| Standard Deviation (Sample) | 9.9% | 12.0% |
| Standard Deviation (Population) | 9.9% | 11.9% |
Similar Demographics by In Labor Force | Age 30-34
Demographics Similar to Finns by In Labor Force | Age 30-34
In terms of in labor force | age 30-34, the demographic groups most similar to Finns are Immigrants from South America (84.7%, a difference of 0.0%), Immigrants from Burma/Myanmar (84.7%, a difference of 0.010%), Irish (84.7%, a difference of 0.010%), Immigrants from England (84.7%, a difference of 0.010%), and Israeli (84.7%, a difference of 0.010%).
| Demographics | Rating | Rank | In Labor Force | Age 30-34 |
| Immigrants | South Eastern Asia | 54.2 /100 | #167 | Average 84.7% |
| Immigrants | Peru | 52.4 /100 | #168 | Average 84.7% |
| South American Indians | 52.1 /100 | #169 | Average 84.7% |
| Immigrants | Burma/Myanmar | 52.0 /100 | #170 | Average 84.7% |
| Irish | 52.0 /100 | #171 | Average 84.7% |
| Immigrants | England | 51.7 /100 | #172 | Average 84.7% |
| Israelis | 51.1 /100 | #173 | Average 84.7% |
| Finns | 50.0 /100 | #174 | Average 84.7% |
| Immigrants | South America | 50.0 /100 | #175 | Average 84.7% |
| Immigrants | Uzbekistan | 49.1 /100 | #176 | Average 84.7% |
| Laotians | 46.9 /100 | #177 | Average 84.7% |
| Okinawans | 44.1 /100 | #178 | Average 84.6% |
| Immigrants | Nigeria | 42.5 /100 | #179 | Average 84.6% |
| Immigrants | Netherlands | 42.1 /100 | #180 | Average 84.6% |
| Moroccans | 40.3 /100 | #181 | Average 84.6% |
Demographics Similar to Immigrants from Barbados by In Labor Force | Age 30-34
In terms of in labor force | age 30-34, the demographic groups most similar to Immigrants from Barbados are Celtic (84.1%, a difference of 0.0%), English (84.0%, a difference of 0.0%), Venezuelan (84.0%, a difference of 0.010%), U.S. Virgin Islander (84.1%, a difference of 0.020%), and French American Indian (84.1%, a difference of 0.030%).
| Demographics | Rating | Rank | In Labor Force | Age 30-34 |
| Malaysians | 2.2 /100 | #231 | Tragic 84.1% |
| Immigrants | Immigrants | 2.0 /100 | #232 | Tragic 84.1% |
| West Indians | 1.9 /100 | #233 | Tragic 84.1% |
| Haitians | 1.8 /100 | #234 | Tragic 84.1% |
| French American Indians | 1.7 /100 | #235 | Tragic 84.1% |
| U.S. Virgin Islanders | 1.5 /100 | #236 | Tragic 84.1% |
| Celtics | 1.4 /100 | #237 | Tragic 84.1% |
| Immigrants | Barbados | 1.4 /100 | #238 | Tragic 84.0% |
| English | 1.4 /100 | #239 | Tragic 84.0% |
| Venezuelans | 1.3 /100 | #240 | Tragic 84.0% |
| Immigrants | Portugal | 1.2 /100 | #241 | Tragic 84.0% |
| Immigrants | Oceania | 1.1 /100 | #242 | Tragic 84.0% |
| Immigrants | Caribbean | 1.1 /100 | #243 | Tragic 84.0% |
| Basques | 0.9 /100 | #244 | Tragic 84.0% |
| Immigrants | Venezuela | 0.9 /100 | #245 | Tragic 84.0% |