Paraguayan vs Immigrants from Italy In Labor Force | Age > 16
COMPARE
Paraguayan
Immigrants from Italy
In Labor Force | Age > 16
In Labor Force | Age > 16 Comparison
Paraguayans
Immigrants from Italy
66.5%
IN LABOR FORCE | AGE > 16
99.9/ 100
METRIC RATING
52nd/ 347
METRIC RANK
65.0%
IN LABOR FORCE | AGE > 16
28.7/ 100
METRIC RATING
197th/ 347
METRIC RANK
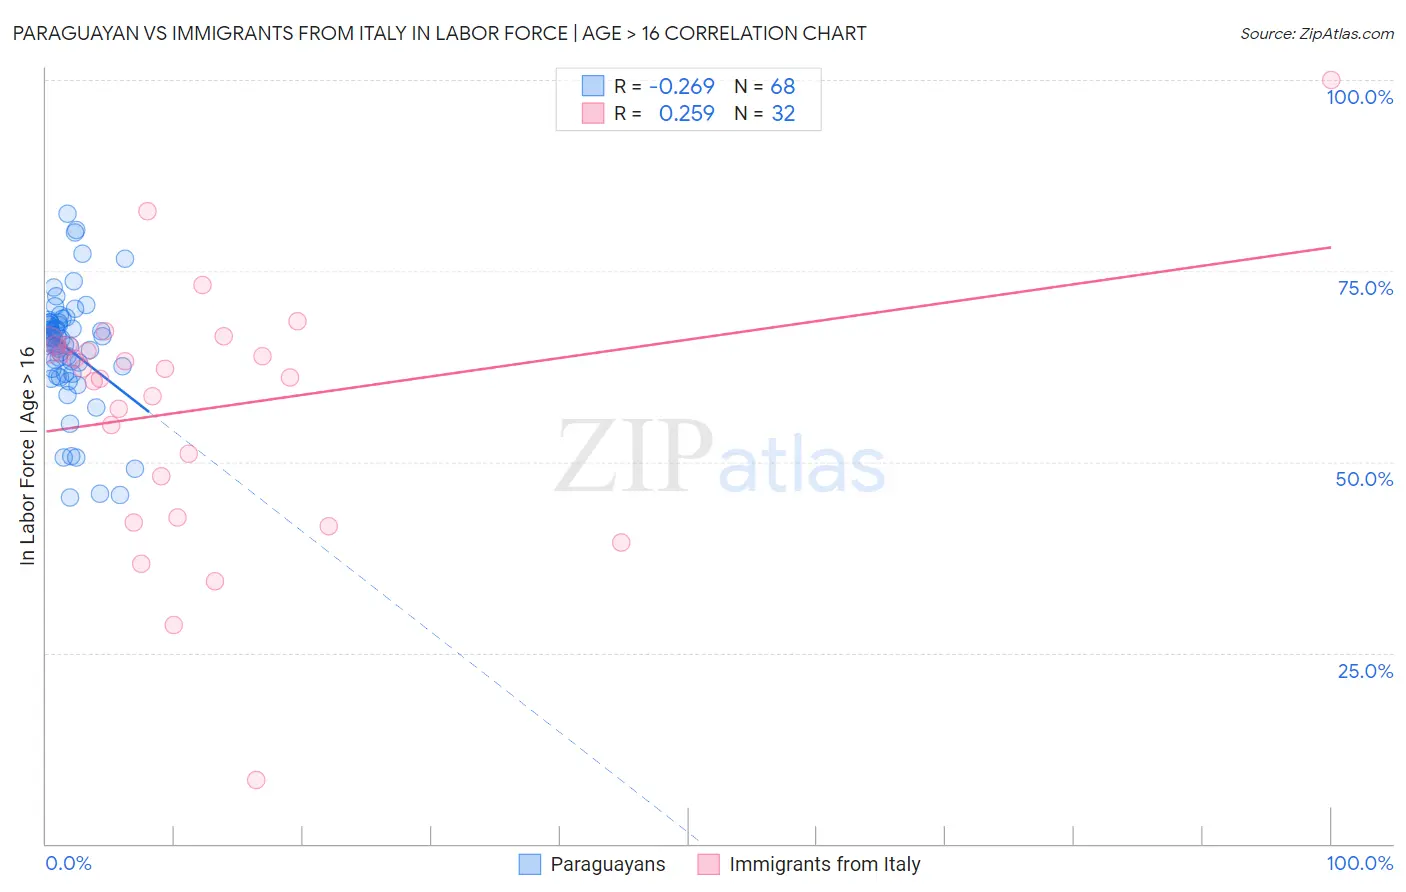
Paraguayan vs Immigrants from Italy In Labor Force | Age > 16 Correlation Chart
The statistical analysis conducted on geographies consisting of 95,115,093 people shows a weak negative correlation between the proportion of Paraguayans and labor force participation rate among population ages 16 and over in the United States with a correlation coefficient (R) of -0.269 and weighted average of 66.5%. Similarly, the statistical analysis conducted on geographies consisting of 324,219,565 people shows a weak positive correlation between the proportion of Immigrants from Italy and labor force participation rate among population ages 16 and over in the United States with a correlation coefficient (R) of 0.259 and weighted average of 65.0%, a difference of 2.4%.
In Labor Force | Age > 16 Correlation Summary
| Measurement | Paraguayan | Immigrants from Italy |
| Minimum | 45.4% | 8.3% |
| Maximum | 82.5% | 100.0% |
| Range | 37.1% | 91.7% |
| Mean | 64.8% | 57.0% |
| Median | 66.1% | 61.6% |
| Interquartile 25% (IQ1) | 61.9% | 45.4% |
| Interquartile 75% (IQ3) | 68.2% | 65.3% |
| Interquartile Range (IQR) | 6.3% | 19.8% |
| Standard Deviation (Sample) | 7.6% | 16.9% |
| Standard Deviation (Population) | 7.5% | 16.6% |
Similar Demographics by In Labor Force | Age > 16
Demographics Similar to Paraguayans by In Labor Force | Age > 16
In terms of in labor force | age > 16, the demographic groups most similar to Paraguayans are Immigrants from Sri Lanka (66.5%, a difference of 0.020%), Immigrants from Kuwait (66.5%, a difference of 0.030%), Immigrants from Bosnia and Herzegovina (66.5%, a difference of 0.050%), Cape Verdean (66.6%, a difference of 0.10%), and Immigrants from Venezuela (66.4%, a difference of 0.10%).
| Demographics | Rating | Rank | In Labor Force | Age > 16 |
| Immigrants | Brazil | 100.0 /100 | #45 | Exceptional 66.7% |
| Brazilians | 100.0 /100 | #46 | Exceptional 66.6% |
| Immigrants | Bulgaria | 100.0 /100 | #47 | Exceptional 66.6% |
| Nigerians | 100.0 /100 | #48 | Exceptional 66.6% |
| Immigrants | Northern Africa | 100.0 /100 | #49 | Exceptional 66.6% |
| Cape Verdeans | 100.0 /100 | #50 | Exceptional 66.6% |
| Immigrants | Kuwait | 100.0 /100 | #51 | Exceptional 66.5% |
| Paraguayans | 99.9 /100 | #52 | Exceptional 66.5% |
| Immigrants | Sri Lanka | 99.9 /100 | #53 | Exceptional 66.5% |
| Immigrants | Bosnia and Herzegovina | 99.9 /100 | #54 | Exceptional 66.5% |
| Immigrants | Venezuela | 99.9 /100 | #55 | Exceptional 66.4% |
| Immigrants | Senegal | 99.9 /100 | #56 | Exceptional 66.4% |
| Bulgarians | 99.9 /100 | #57 | Exceptional 66.4% |
| Immigrants | Saudi Arabia | 99.9 /100 | #58 | Exceptional 66.3% |
| Immigrants | Turkey | 99.9 /100 | #59 | Exceptional 66.3% |
Demographics Similar to Immigrants from Italy by In Labor Force | Age > 16
In terms of in labor force | age > 16, the demographic groups most similar to Immigrants from Italy are Romanian (65.0%, a difference of 0.030%), Haitian (65.0%, a difference of 0.030%), Immigrants from Southern Europe (65.0%, a difference of 0.040%), Greek (64.9%, a difference of 0.040%), and Immigrants from Europe (65.0%, a difference of 0.060%).
| Demographics | Rating | Rank | In Labor Force | Age > 16 |
| Barbadians | 33.9 /100 | #190 | Fair 65.0% |
| Scandinavians | 33.7 /100 | #191 | Fair 65.0% |
| Immigrants | Fiji | 33.7 /100 | #192 | Fair 65.0% |
| Immigrants | Europe | 33.6 /100 | #193 | Fair 65.0% |
| Immigrants | Southern Europe | 31.3 /100 | #194 | Fair 65.0% |
| Romanians | 31.1 /100 | #195 | Fair 65.0% |
| Haitians | 30.6 /100 | #196 | Fair 65.0% |
| Immigrants | Italy | 28.7 /100 | #197 | Fair 65.0% |
| Greeks | 26.1 /100 | #198 | Fair 64.9% |
| Mexican American Indians | 23.1 /100 | #199 | Fair 64.9% |
| Armenians | 20.2 /100 | #200 | Fair 64.9% |
| Ukrainians | 19.6 /100 | #201 | Poor 64.9% |
| Immigrants | Belgium | 19.4 /100 | #202 | Poor 64.9% |
| Russians | 18.8 /100 | #203 | Poor 64.9% |
| Slovenes | 18.7 /100 | #204 | Poor 64.9% |