Cambodian vs Immigrants from Cuba In Labor Force | Age 16-19
COMPARE
Cambodian
Immigrants from Cuba
In Labor Force | Age 16-19
In Labor Force | Age 16-19 Comparison
Cambodians
Immigrants from Cuba
37.0%
IN LABOR FORCE | AGE 16-19
71.5/ 100
METRIC RATING
161st/ 347
METRIC RANK
30.2%
IN LABOR FORCE | AGE 16-19
0.0/ 100
METRIC RATING
335th/ 347
METRIC RANK
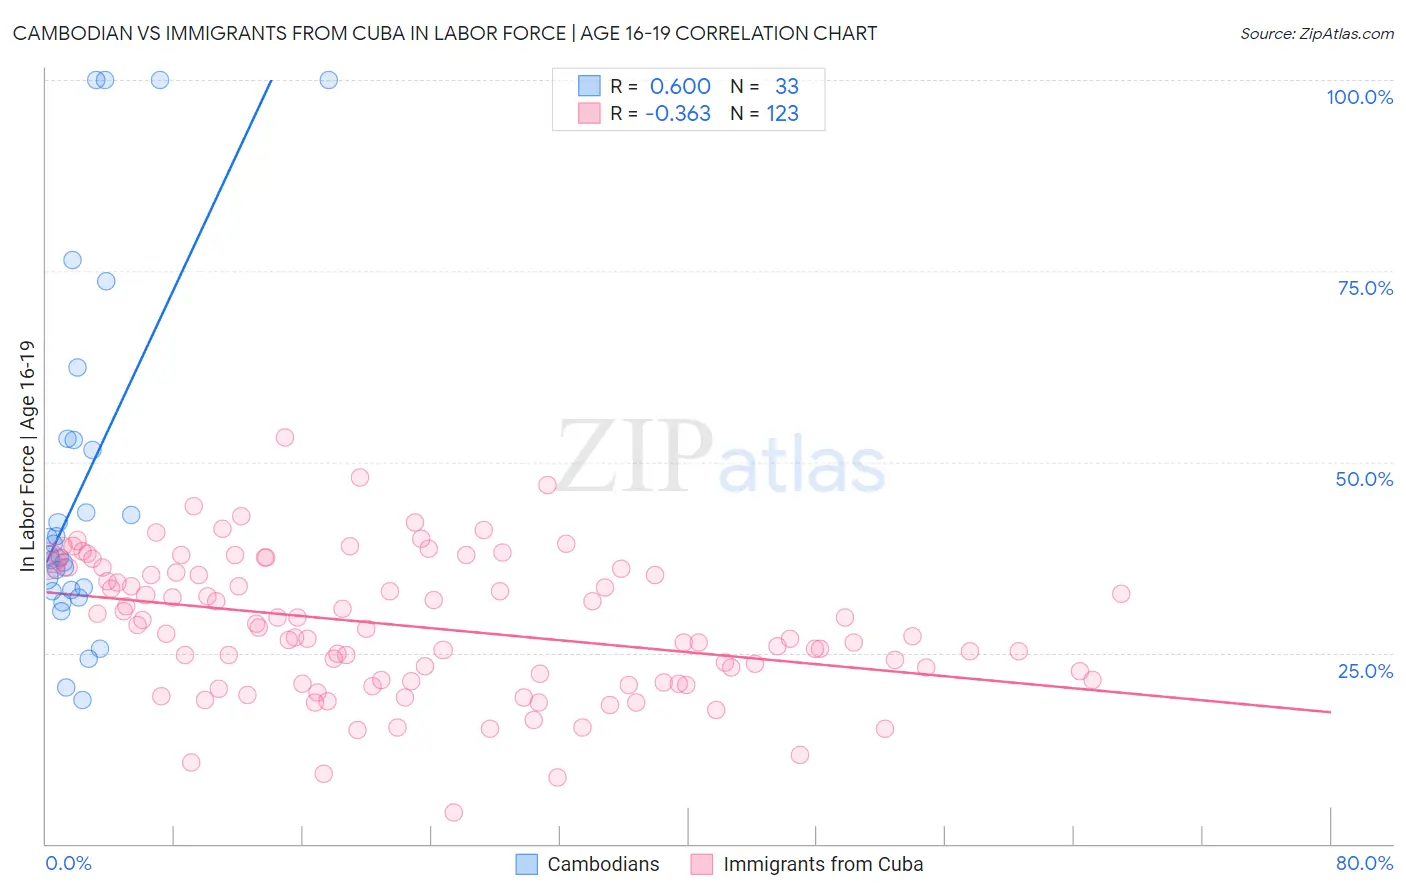
Cambodian vs Immigrants from Cuba In Labor Force | Age 16-19 Correlation Chart
The statistical analysis conducted on geographies consisting of 102,494,767 people shows a significant positive correlation between the proportion of Cambodians and labor force participation rate among population between the ages 16 and 19 in the United States with a correlation coefficient (R) of 0.600 and weighted average of 37.0%. Similarly, the statistical analysis conducted on geographies consisting of 325,558,601 people shows a mild negative correlation between the proportion of Immigrants from Cuba and labor force participation rate among population between the ages 16 and 19 in the United States with a correlation coefficient (R) of -0.363 and weighted average of 30.2%, a difference of 22.3%.
In Labor Force | Age 16-19 Correlation Summary
| Measurement | Cambodian | Immigrants from Cuba |
| Minimum | 18.8% | 4.1% |
| Maximum | 100.0% | 53.2% |
| Range | 81.2% | 49.1% |
| Mean | 47.2% | 28.4% |
| Median | 37.7% | 28.1% |
| Interquartile 25% (IQ1) | 33.2% | 21.2% |
| Interquartile 75% (IQ3) | 53.0% | 36.0% |
| Interquartile Range (IQR) | 19.8% | 14.8% |
| Standard Deviation (Sample) | 23.6% | 9.1% |
| Standard Deviation (Population) | 23.3% | 9.0% |
Similar Demographics by In Labor Force | Age 16-19
Demographics Similar to Cambodians by In Labor Force | Age 16-19
In terms of in labor force | age 16-19, the demographic groups most similar to Cambodians are Immigrants from Jordan (36.9%, a difference of 0.12%), Bermudan (36.9%, a difference of 0.13%), Immigrants from Saudi Arabia (37.0%, a difference of 0.15%), Immigrants from Kuwait (36.9%, a difference of 0.16%), and Yaqui (37.1%, a difference of 0.18%).
| Demographics | Rating | Rank | In Labor Force | Age 16-19 |
| Immigrants | Bulgaria | 81.6 /100 | #154 | Excellent 37.3% |
| Immigrants | Lithuania | 80.7 /100 | #155 | Excellent 37.2% |
| Kiowa | 80.4 /100 | #156 | Excellent 37.2% |
| Immigrants | Brazil | 76.5 /100 | #157 | Good 37.1% |
| Ute | 75.7 /100 | #158 | Good 37.1% |
| Yaqui | 74.4 /100 | #159 | Good 37.1% |
| Immigrants | Saudi Arabia | 73.9 /100 | #160 | Good 37.0% |
| Cambodians | 71.5 /100 | #161 | Good 37.0% |
| Immigrants | Jordan | 69.5 /100 | #162 | Good 36.9% |
| Bermudans | 69.3 /100 | #163 | Good 36.9% |
| Immigrants | Kuwait | 68.9 /100 | #164 | Good 36.9% |
| Yakama | 66.9 /100 | #165 | Good 36.9% |
| Immigrants | Western Africa | 66.7 /100 | #166 | Good 36.9% |
| Arabs | 63.6 /100 | #167 | Good 36.8% |
| Palestinians | 63.1 /100 | #168 | Good 36.8% |
Demographics Similar to Immigrants from Cuba by In Labor Force | Age 16-19
In terms of in labor force | age 16-19, the demographic groups most similar to Immigrants from Cuba are Immigrants from Trinidad and Tobago (30.2%, a difference of 0.29%), Puerto Rican (30.3%, a difference of 0.33%), Immigrants from Bangladesh (30.0%, a difference of 0.66%), Immigrants from Hong Kong (30.5%, a difference of 0.75%), and Immigrants from Israel (30.5%, a difference of 0.77%).
| Demographics | Rating | Rank | In Labor Force | Age 16-19 |
| Immigrants | Ecuador | 0.0 /100 | #328 | Tragic 31.0% |
| Barbadians | 0.0 /100 | #329 | Tragic 31.0% |
| Lumbee | 0.0 /100 | #330 | Tragic 31.0% |
| Trinidadians and Tobagonians | 0.0 /100 | #331 | Tragic 30.9% |
| Immigrants | Israel | 0.0 /100 | #332 | Tragic 30.5% |
| Immigrants | Hong Kong | 0.0 /100 | #333 | Tragic 30.5% |
| Puerto Ricans | 0.0 /100 | #334 | Tragic 30.3% |
| Immigrants | Cuba | 0.0 /100 | #335 | Tragic 30.2% |
| Immigrants | Trinidad and Tobago | 0.0 /100 | #336 | Tragic 30.2% |
| Immigrants | Bangladesh | 0.0 /100 | #337 | Tragic 30.0% |
| Vietnamese | 0.0 /100 | #338 | Tragic 29.6% |
| Immigrants | Uzbekistan | 0.0 /100 | #339 | Tragic 29.2% |
| British West Indians | 0.0 /100 | #340 | Tragic 29.1% |
| Immigrants | Armenia | 0.0 /100 | #341 | Tragic 29.0% |
| Immigrants | Barbados | 0.0 /100 | #342 | Tragic 29.0% |