Filipino vs Immigrants from Cuba 10th Grade
COMPARE
Filipino
Immigrants from Cuba
10th Grade
10th Grade Comparison
Filipinos
Immigrants from Cuba
94.8%
10TH GRADE
99.3/ 100
METRIC RATING
78th/ 347
METRIC RANK
90.2%
10TH GRADE
0.0/ 100
METRIC RATING
318th/ 347
METRIC RANK
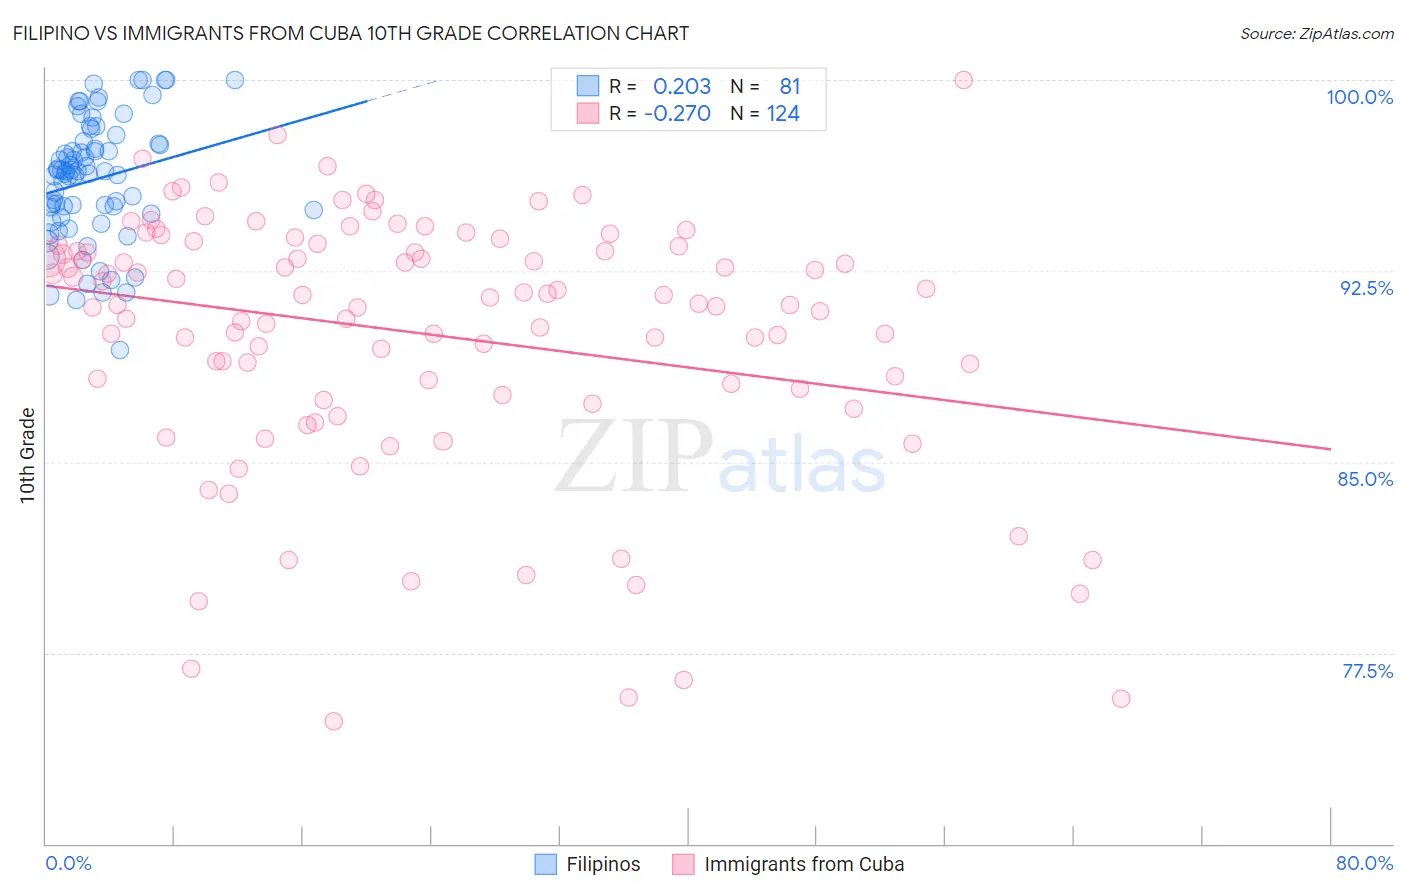
Filipino vs Immigrants from Cuba 10th Grade Correlation Chart
The statistical analysis conducted on geographies consisting of 254,351,912 people shows a weak positive correlation between the proportion of Filipinos and percentage of population with at least 10th grade education in the United States with a correlation coefficient (R) of 0.203 and weighted average of 94.8%. Similarly, the statistical analysis conducted on geographies consisting of 326,019,170 people shows a weak negative correlation between the proportion of Immigrants from Cuba and percentage of population with at least 10th grade education in the United States with a correlation coefficient (R) of -0.270 and weighted average of 90.2%, a difference of 5.0%.
10th Grade Correlation Summary
| Measurement | Filipino | Immigrants from Cuba |
| Minimum | 89.4% | 74.8% |
| Maximum | 100.0% | 100.0% |
| Range | 10.6% | 25.2% |
| Mean | 96.1% | 90.1% |
| Median | 96.4% | 91.3% |
| Interquartile 25% (IQ1) | 94.7% | 88.0% |
| Interquartile 75% (IQ3) | 97.5% | 93.5% |
| Interquartile Range (IQR) | 2.8% | 5.5% |
| Standard Deviation (Sample) | 2.4% | 5.0% |
| Standard Deviation (Population) | 2.4% | 5.0% |
Similar Demographics by 10th Grade
Demographics Similar to Filipinos by 10th Grade
In terms of 10th grade, the demographic groups most similar to Filipinos are Immigrants from Czechoslovakia (94.7%, a difference of 0.030%), Immigrants from Denmark (94.7%, a difference of 0.040%), Immigrants from Latvia (94.7%, a difference of 0.040%), Romanian (94.8%, a difference of 0.060%), and Immigrants from South Africa (94.8%, a difference of 0.060%).
| Demographics | Rating | Rank | 10th Grade |
| Alaska Natives | 99.6 /100 | #71 | Exceptional 94.9% |
| Immigrants | Sweden | 99.6 /100 | #72 | Exceptional 94.9% |
| Bhutanese | 99.6 /100 | #73 | Exceptional 94.9% |
| Canadians | 99.6 /100 | #74 | Exceptional 94.9% |
| Okinawans | 99.5 /100 | #75 | Exceptional 94.8% |
| Romanians | 99.5 /100 | #76 | Exceptional 94.8% |
| Immigrants | South Africa | 99.5 /100 | #77 | Exceptional 94.8% |
| Filipinos | 99.3 /100 | #78 | Exceptional 94.8% |
| Immigrants | Czechoslovakia | 99.2 /100 | #79 | Exceptional 94.7% |
| Immigrants | Denmark | 99.2 /100 | #80 | Exceptional 94.7% |
| Immigrants | Latvia | 99.2 /100 | #81 | Exceptional 94.7% |
| Swiss | 99.1 /100 | #82 | Exceptional 94.7% |
| Immigrants | Western Europe | 99.1 /100 | #83 | Exceptional 94.7% |
| Icelanders | 99.1 /100 | #84 | Exceptional 94.7% |
| Crow | 99.0 /100 | #85 | Exceptional 94.7% |
Demographics Similar to Immigrants from Cuba by 10th Grade
In terms of 10th grade, the demographic groups most similar to Immigrants from Cuba are Nicaraguan (90.2%, a difference of 0.080%), Houma (90.2%, a difference of 0.090%), Belizean (90.2%, a difference of 0.090%), Tohono O'odham (90.1%, a difference of 0.10%), and Immigrants from Belize (90.1%, a difference of 0.19%).
| Demographics | Rating | Rank | 10th Grade |
| Immigrants | Cambodia | 0.0 /100 | #311 | Tragic 90.9% |
| Immigrants | Portugal | 0.0 /100 | #312 | Tragic 90.8% |
| Cape Verdeans | 0.0 /100 | #313 | Tragic 90.8% |
| Nepalese | 0.0 /100 | #314 | Tragic 90.7% |
| Immigrants | Caribbean | 0.0 /100 | #315 | Tragic 90.6% |
| Ecuadorians | 0.0 /100 | #316 | Tragic 90.6% |
| Immigrants | Ecuador | 0.0 /100 | #317 | Tragic 90.4% |
| Immigrants | Cuba | 0.0 /100 | #318 | Tragic 90.2% |
| Nicaraguans | 0.0 /100 | #319 | Tragic 90.2% |
| Houma | 0.0 /100 | #320 | Tragic 90.2% |
| Belizeans | 0.0 /100 | #321 | Tragic 90.2% |
| Tohono O'odham | 0.0 /100 | #322 | Tragic 90.1% |
| Immigrants | Belize | 0.0 /100 | #323 | Tragic 90.1% |
| Immigrants | Armenia | 0.0 /100 | #324 | Tragic 89.9% |
| Puerto Ricans | 0.0 /100 | #325 | Tragic 89.8% |