European vs Immigrants from Austria In Labor Force | Age 16-19
COMPARE
European
Immigrants from Austria
In Labor Force | Age 16-19
In Labor Force | Age 16-19 Comparison
Europeans
Immigrants from Austria
41.1%
IN LABOR FORCE | AGE 16-19
100.0/ 100
METRIC RATING
44th/ 347
METRIC RANK
37.9%
IN LABOR FORCE | AGE 16-19
95.0/ 100
METRIC RATING
131st/ 347
METRIC RANK
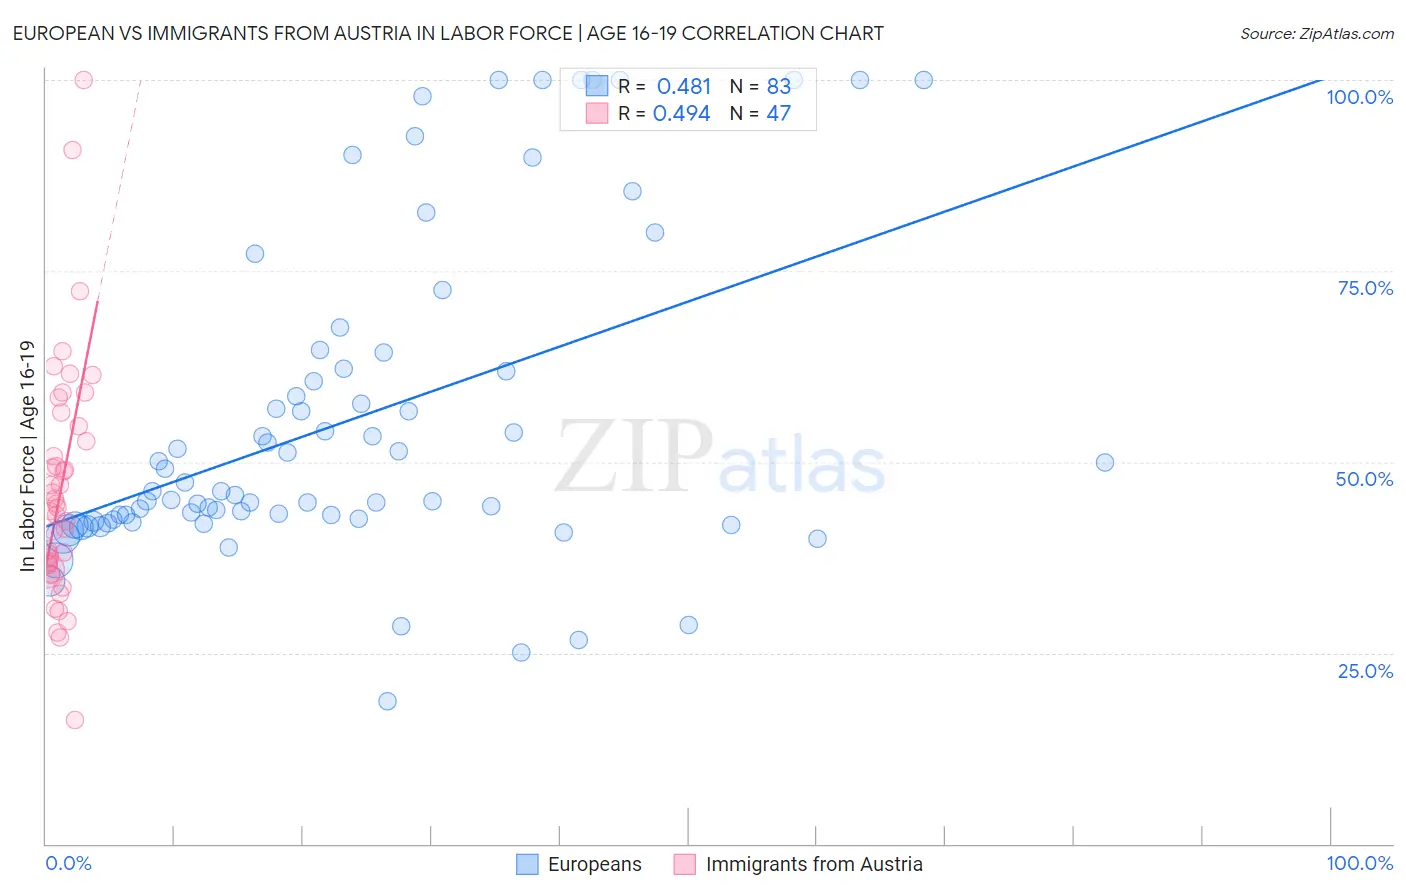
European vs Immigrants from Austria In Labor Force | Age 16-19 Correlation Chart
The statistical analysis conducted on geographies consisting of 558,493,487 people shows a moderate positive correlation between the proportion of Europeans and labor force participation rate among population between the ages 16 and 19 in the United States with a correlation coefficient (R) of 0.481 and weighted average of 41.1%. Similarly, the statistical analysis conducted on geographies consisting of 167,731,436 people shows a moderate positive correlation between the proportion of Immigrants from Austria and labor force participation rate among population between the ages 16 and 19 in the United States with a correlation coefficient (R) of 0.494 and weighted average of 37.9%, a difference of 8.5%.
In Labor Force | Age 16-19 Correlation Summary
| Measurement | European | Immigrants from Austria |
| Minimum | 18.6% | 16.2% |
| Maximum | 100.0% | 100.0% |
| Range | 81.4% | 83.8% |
| Mean | 55.4% | 46.4% |
| Median | 46.1% | 44.0% |
| Interquartile 25% (IQ1) | 42.3% | 36.6% |
| Interquartile 75% (IQ3) | 62.2% | 54.7% |
| Interquartile Range (IQR) | 20.0% | 18.1% |
| Standard Deviation (Sample) | 21.0% | 15.5% |
| Standard Deviation (Population) | 20.9% | 15.4% |
Similar Demographics by In Labor Force | Age 16-19
Demographics Similar to Europeans by In Labor Force | Age 16-19
In terms of in labor force | age 16-19, the demographic groups most similar to Europeans are Croatian (41.1%, a difference of 0.040%), Tongan (41.2%, a difference of 0.10%), Immigrants from Sudan (41.0%, a difference of 0.36%), White/Caucasian (41.3%, a difference of 0.41%), and Celtic (41.3%, a difference of 0.42%).
| Demographics | Rating | Rank | In Labor Force | Age 16-19 |
| Immigrants | Congo | 100.0 /100 | #37 | Exceptional 41.7% |
| Sioux | 100.0 /100 | #38 | Exceptional 41.5% |
| Scotch-Irish | 100.0 /100 | #39 | Exceptional 41.5% |
| Immigrants | Liberia | 100.0 /100 | #40 | Exceptional 41.5% |
| Celtics | 100.0 /100 | #41 | Exceptional 41.3% |
| Whites/Caucasians | 100.0 /100 | #42 | Exceptional 41.3% |
| Tongans | 100.0 /100 | #43 | Exceptional 41.2% |
| Europeans | 100.0 /100 | #44 | Exceptional 41.1% |
| Croatians | 100.0 /100 | #45 | Exceptional 41.1% |
| Immigrants | Sudan | 100.0 /100 | #46 | Exceptional 41.0% |
| Carpatho Rusyns | 100.0 /100 | #47 | Exceptional 40.8% |
| Icelanders | 100.0 /100 | #48 | Exceptional 40.8% |
| Cree | 100.0 /100 | #49 | Exceptional 40.8% |
| Indonesians | 100.0 /100 | #50 | Exceptional 40.7% |
| Immigrants | Zaire | 100.0 /100 | #51 | Exceptional 40.7% |
Demographics Similar to Immigrants from Austria by In Labor Force | Age 16-19
In terms of in labor force | age 16-19, the demographic groups most similar to Immigrants from Austria are Immigrants from Oceania (37.9%, a difference of 0.080%), Immigrants from Zimbabwe (38.0%, a difference of 0.090%), Cheyenne (37.9%, a difference of 0.11%), Spaniard (38.0%, a difference of 0.12%), and Choctaw (38.0%, a difference of 0.15%).
| Demographics | Rating | Rank | In Labor Force | Age 16-19 |
| Immigrants | England | 96.4 /100 | #124 | Exceptional 38.1% |
| Immigrants | Africa | 96.1 /100 | #125 | Exceptional 38.0% |
| Africans | 95.6 /100 | #126 | Exceptional 38.0% |
| Choctaw | 95.6 /100 | #127 | Exceptional 38.0% |
| New Zealanders | 95.6 /100 | #128 | Exceptional 38.0% |
| Spaniards | 95.5 /100 | #129 | Exceptional 38.0% |
| Immigrants | Zimbabwe | 95.4 /100 | #130 | Exceptional 38.0% |
| Immigrants | Austria | 95.0 /100 | #131 | Exceptional 37.9% |
| Immigrants | Oceania | 94.7 /100 | #132 | Exceptional 37.9% |
| Cheyenne | 94.6 /100 | #133 | Exceptional 37.9% |
| Immigrants | Netherlands | 93.7 /100 | #134 | Exceptional 37.8% |
| Macedonians | 93.4 /100 | #135 | Exceptional 37.8% |
| Australians | 93.2 /100 | #136 | Exceptional 37.8% |
| Cajuns | 93.2 /100 | #137 | Exceptional 37.8% |
| Comanche | 91.9 /100 | #138 | Exceptional 37.7% |