European vs Indian (Asian) In Labor Force | Age 16-19
COMPARE
European
Indian (Asian)
In Labor Force | Age 16-19
In Labor Force | Age 16-19 Comparison
Europeans
Indians (Asian)
41.1%
IN LABOR FORCE | AGE 16-19
100.0/ 100
METRIC RATING
44th/ 347
METRIC RANK
31.9%
IN LABOR FORCE | AGE 16-19
0.0/ 100
METRIC RATING
311th/ 347
METRIC RANK
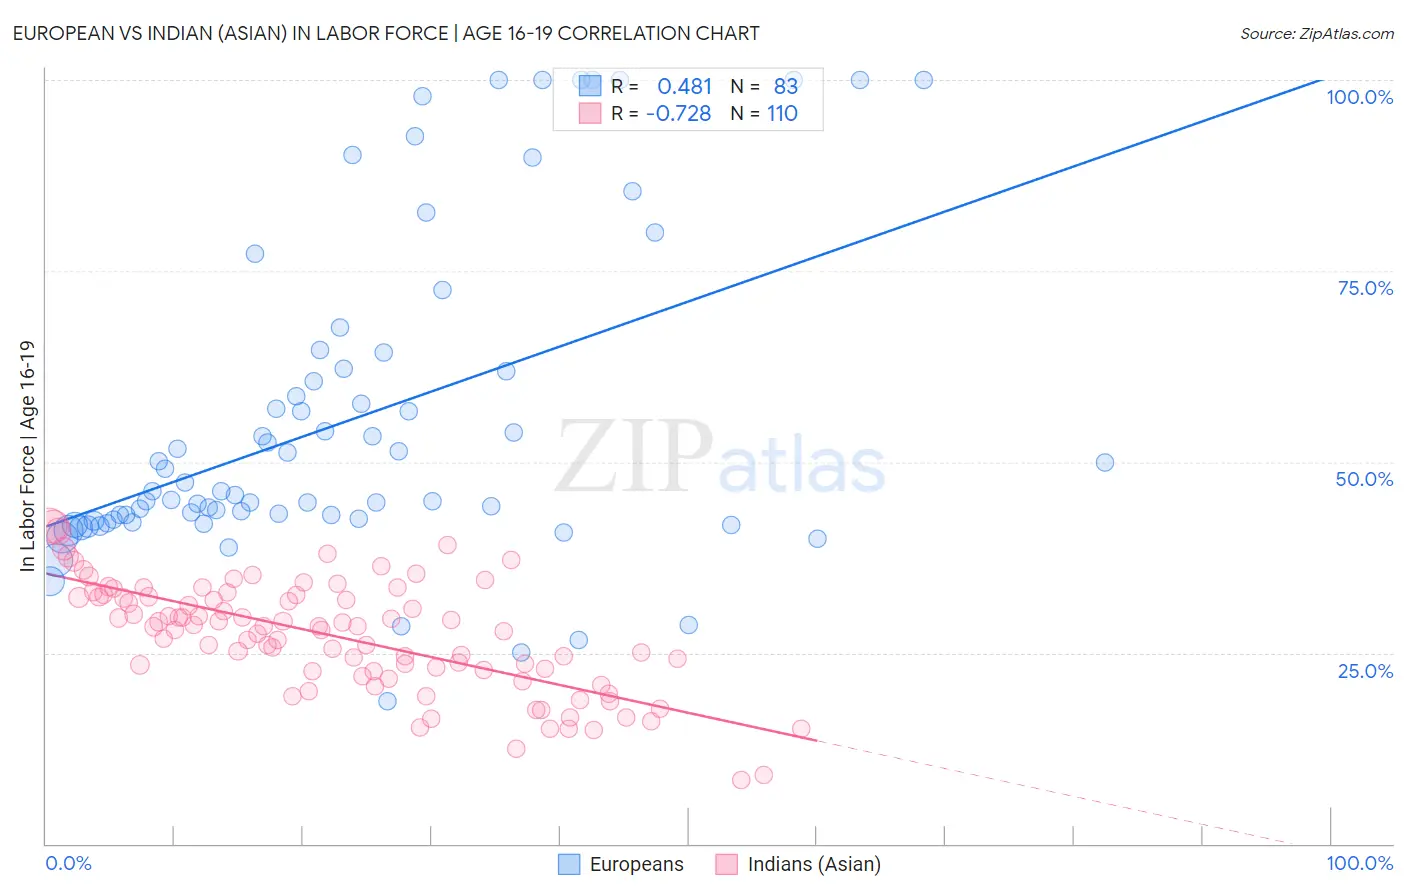
European vs Indian (Asian) In Labor Force | Age 16-19 Correlation Chart
The statistical analysis conducted on geographies consisting of 558,493,487 people shows a moderate positive correlation between the proportion of Europeans and labor force participation rate among population between the ages 16 and 19 in the United States with a correlation coefficient (R) of 0.481 and weighted average of 41.1%. Similarly, the statistical analysis conducted on geographies consisting of 494,104,019 people shows a strong negative correlation between the proportion of Indians (Asian) and labor force participation rate among population between the ages 16 and 19 in the United States with a correlation coefficient (R) of -0.728 and weighted average of 31.9%, a difference of 29.1%.
In Labor Force | Age 16-19 Correlation Summary
| Measurement | European | Indian (Asian) |
| Minimum | 18.6% | 8.3% |
| Maximum | 100.0% | 41.5% |
| Range | 81.4% | 33.2% |
| Mean | 55.4% | 27.1% |
| Median | 46.1% | 28.4% |
| Interquartile 25% (IQ1) | 42.3% | 22.7% |
| Interquartile 75% (IQ3) | 62.2% | 32.3% |
| Interquartile Range (IQR) | 20.0% | 9.7% |
| Standard Deviation (Sample) | 21.0% | 7.2% |
| Standard Deviation (Population) | 20.9% | 7.2% |
Similar Demographics by In Labor Force | Age 16-19
Demographics Similar to Europeans by In Labor Force | Age 16-19
In terms of in labor force | age 16-19, the demographic groups most similar to Europeans are Croatian (41.1%, a difference of 0.040%), Tongan (41.2%, a difference of 0.10%), Immigrants from Sudan (41.0%, a difference of 0.36%), White/Caucasian (41.3%, a difference of 0.41%), and Celtic (41.3%, a difference of 0.42%).
| Demographics | Rating | Rank | In Labor Force | Age 16-19 |
| Immigrants | Congo | 100.0 /100 | #37 | Exceptional 41.7% |
| Sioux | 100.0 /100 | #38 | Exceptional 41.5% |
| Scotch-Irish | 100.0 /100 | #39 | Exceptional 41.5% |
| Immigrants | Liberia | 100.0 /100 | #40 | Exceptional 41.5% |
| Celtics | 100.0 /100 | #41 | Exceptional 41.3% |
| Whites/Caucasians | 100.0 /100 | #42 | Exceptional 41.3% |
| Tongans | 100.0 /100 | #43 | Exceptional 41.2% |
| Europeans | 100.0 /100 | #44 | Exceptional 41.1% |
| Croatians | 100.0 /100 | #45 | Exceptional 41.1% |
| Immigrants | Sudan | 100.0 /100 | #46 | Exceptional 41.0% |
| Carpatho Rusyns | 100.0 /100 | #47 | Exceptional 40.8% |
| Icelanders | 100.0 /100 | #48 | Exceptional 40.8% |
| Cree | 100.0 /100 | #49 | Exceptional 40.8% |
| Indonesians | 100.0 /100 | #50 | Exceptional 40.7% |
| Immigrants | Zaire | 100.0 /100 | #51 | Exceptional 40.7% |
Demographics Similar to Indians (Asian) by In Labor Force | Age 16-19
In terms of in labor force | age 16-19, the demographic groups most similar to Indians (Asian) are Immigrants from Belize (31.8%, a difference of 0.14%), Hopi (31.8%, a difference of 0.15%), Cuban (31.8%, a difference of 0.31%), Immigrants from Iran (32.0%, a difference of 0.37%), and Immigrants from West Indies (31.7%, a difference of 0.49%).
| Demographics | Rating | Rank | In Labor Force | Age 16-19 |
| Israelis | 0.0 /100 | #304 | Tragic 32.4% |
| Nicaraguans | 0.0 /100 | #305 | Tragic 32.4% |
| Spanish American Indians | 0.0 /100 | #306 | Tragic 32.4% |
| Immigrants | Jamaica | 0.0 /100 | #307 | Tragic 32.2% |
| Navajo | 0.0 /100 | #308 | Tragic 32.1% |
| Immigrants | Eastern Asia | 0.0 /100 | #309 | Tragic 32.0% |
| Immigrants | Iran | 0.0 /100 | #310 | Tragic 32.0% |
| Indians (Asian) | 0.0 /100 | #311 | Tragic 31.9% |
| Immigrants | Belize | 0.0 /100 | #312 | Tragic 31.8% |
| Hopi | 0.0 /100 | #313 | Tragic 31.8% |
| Cubans | 0.0 /100 | #314 | Tragic 31.8% |
| Immigrants | West Indies | 0.0 /100 | #315 | Tragic 31.7% |
| Filipinos | 0.0 /100 | #316 | Tragic 31.7% |
| Immigrants | Nicaragua | 0.0 /100 | #317 | Tragic 31.6% |
| Immigrants | Yemen | 0.0 /100 | #318 | Tragic 31.5% |