U.S. Virgin Islander vs Immigrants from Austria In Labor Force | Age 16-19
COMPARE
U.S. Virgin Islander
Immigrants from Austria
In Labor Force | Age 16-19
In Labor Force | Age 16-19 Comparison
U.S. Virgin Islanders
Immigrants from Austria
33.6%
IN LABOR FORCE | AGE 16-19
0.2/ 100
METRIC RATING
285th/ 347
METRIC RANK
37.9%
IN LABOR FORCE | AGE 16-19
95.0/ 100
METRIC RATING
131st/ 347
METRIC RANK
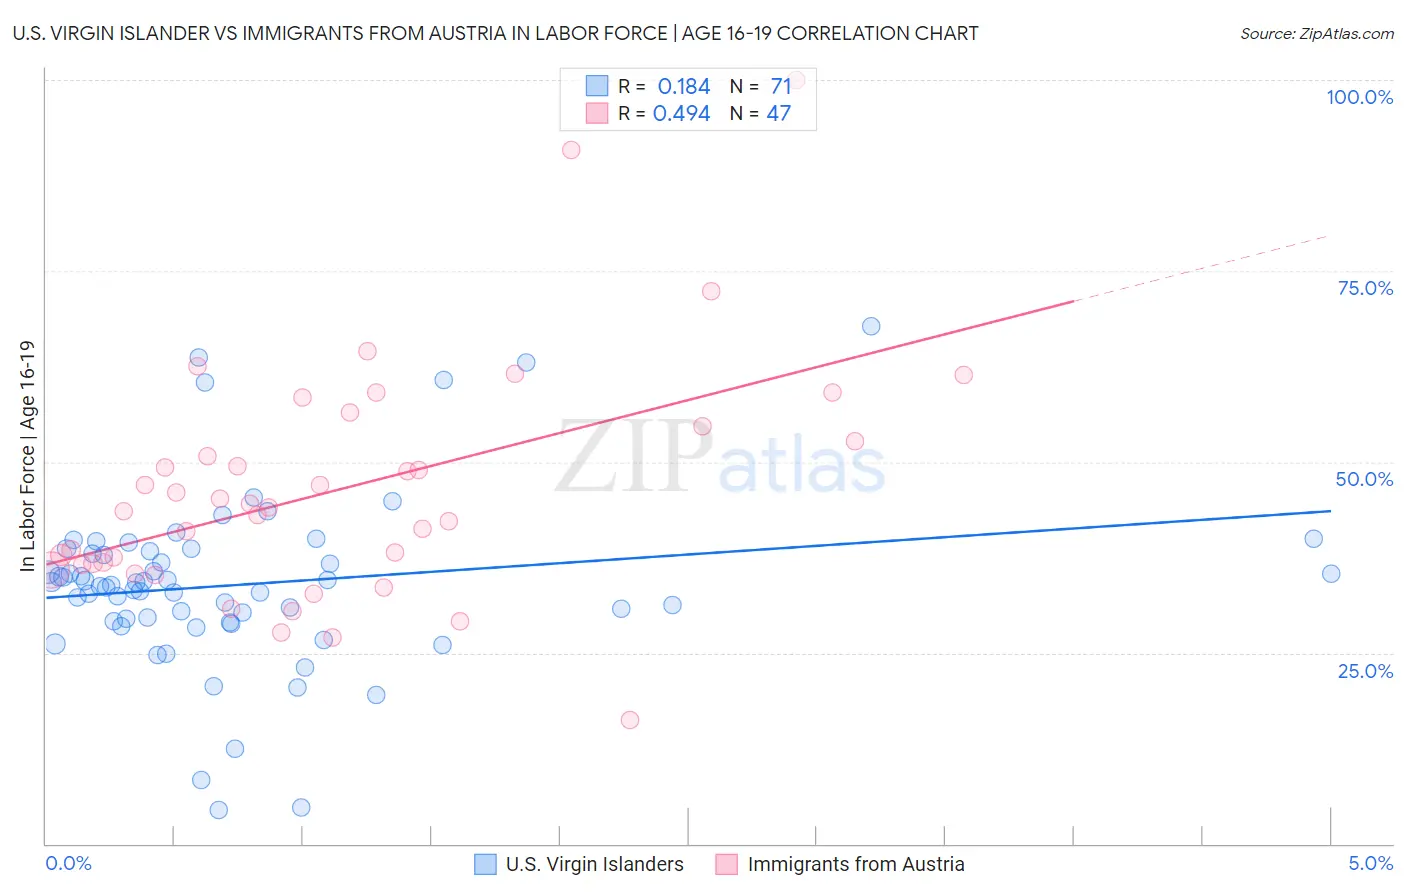
U.S. Virgin Islander vs Immigrants from Austria In Labor Force | Age 16-19 Correlation Chart
The statistical analysis conducted on geographies consisting of 87,491,211 people shows a poor positive correlation between the proportion of U.S. Virgin Islanders and labor force participation rate among population between the ages 16 and 19 in the United States with a correlation coefficient (R) of 0.184 and weighted average of 33.6%. Similarly, the statistical analysis conducted on geographies consisting of 167,731,436 people shows a moderate positive correlation between the proportion of Immigrants from Austria and labor force participation rate among population between the ages 16 and 19 in the United States with a correlation coefficient (R) of 0.494 and weighted average of 37.9%, a difference of 12.8%.
In Labor Force | Age 16-19 Correlation Summary
| Measurement | U.S. Virgin Islander | Immigrants from Austria |
| Minimum | 4.4% | 16.2% |
| Maximum | 67.8% | 100.0% |
| Range | 63.4% | 83.8% |
| Mean | 34.0% | 46.4% |
| Median | 33.9% | 44.0% |
| Interquartile 25% (IQ1) | 29.1% | 36.6% |
| Interquartile 75% (IQ3) | 38.3% | 54.7% |
| Interquartile Range (IQR) | 9.2% | 18.1% |
| Standard Deviation (Sample) | 11.4% | 15.5% |
| Standard Deviation (Population) | 11.4% | 15.4% |
Similar Demographics by In Labor Force | Age 16-19
Demographics Similar to U.S. Virgin Islanders by In Labor Force | Age 16-19
In terms of in labor force | age 16-19, the demographic groups most similar to U.S. Virgin Islanders are South American (33.6%, a difference of 0.080%), Immigrants from Spain (33.7%, a difference of 0.19%), Immigrants from Venezuela (33.7%, a difference of 0.25%), Nepalese (33.5%, a difference of 0.31%), and Immigrants from Indonesia (33.5%, a difference of 0.35%).
| Demographics | Rating | Rank | In Labor Force | Age 16-19 |
| Colombians | 0.3 /100 | #278 | Tragic 33.8% |
| Paraguayans | 0.3 /100 | #279 | Tragic 33.8% |
| Taiwanese | 0.3 /100 | #280 | Tragic 33.8% |
| Cypriots | 0.3 /100 | #281 | Tragic 33.8% |
| Immigrants | Korea | 0.3 /100 | #282 | Tragic 33.8% |
| Immigrants | Venezuela | 0.2 /100 | #283 | Tragic 33.7% |
| Immigrants | Spain | 0.2 /100 | #284 | Tragic 33.7% |
| U.S. Virgin Islanders | 0.2 /100 | #285 | Tragic 33.6% |
| South Americans | 0.2 /100 | #286 | Tragic 33.6% |
| Nepalese | 0.1 /100 | #287 | Tragic 33.5% |
| Immigrants | Indonesia | 0.1 /100 | #288 | Tragic 33.5% |
| Immigrants | Singapore | 0.1 /100 | #289 | Tragic 33.5% |
| Immigrants | Colombia | 0.1 /100 | #290 | Tragic 33.5% |
| Immigrants | Belarus | 0.1 /100 | #291 | Tragic 33.4% |
| Haitians | 0.1 /100 | #292 | Tragic 33.4% |
Demographics Similar to Immigrants from Austria by In Labor Force | Age 16-19
In terms of in labor force | age 16-19, the demographic groups most similar to Immigrants from Austria are Immigrants from Oceania (37.9%, a difference of 0.080%), Immigrants from Zimbabwe (38.0%, a difference of 0.090%), Cheyenne (37.9%, a difference of 0.11%), Spaniard (38.0%, a difference of 0.12%), and Choctaw (38.0%, a difference of 0.15%).
| Demographics | Rating | Rank | In Labor Force | Age 16-19 |
| Immigrants | England | 96.4 /100 | #124 | Exceptional 38.1% |
| Immigrants | Africa | 96.1 /100 | #125 | Exceptional 38.0% |
| Africans | 95.6 /100 | #126 | Exceptional 38.0% |
| Choctaw | 95.6 /100 | #127 | Exceptional 38.0% |
| New Zealanders | 95.6 /100 | #128 | Exceptional 38.0% |
| Spaniards | 95.5 /100 | #129 | Exceptional 38.0% |
| Immigrants | Zimbabwe | 95.4 /100 | #130 | Exceptional 38.0% |
| Immigrants | Austria | 95.0 /100 | #131 | Exceptional 37.9% |
| Immigrants | Oceania | 94.7 /100 | #132 | Exceptional 37.9% |
| Cheyenne | 94.6 /100 | #133 | Exceptional 37.9% |
| Immigrants | Netherlands | 93.7 /100 | #134 | Exceptional 37.8% |
| Macedonians | 93.4 /100 | #135 | Exceptional 37.8% |
| Australians | 93.2 /100 | #136 | Exceptional 37.8% |
| Cajuns | 93.2 /100 | #137 | Exceptional 37.8% |
| Comanche | 91.9 /100 | #138 | Exceptional 37.7% |