European vs Slovak In Labor Force | Age 16-19
COMPARE
European
Slovak
In Labor Force | Age 16-19
In Labor Force | Age 16-19 Comparison
Europeans
Slovaks
41.1%
IN LABOR FORCE | AGE 16-19
100.0/ 100
METRIC RATING
44th/ 347
METRIC RANK
42.6%
IN LABOR FORCE | AGE 16-19
100.0/ 100
METRIC RATING
23rd/ 347
METRIC RANK
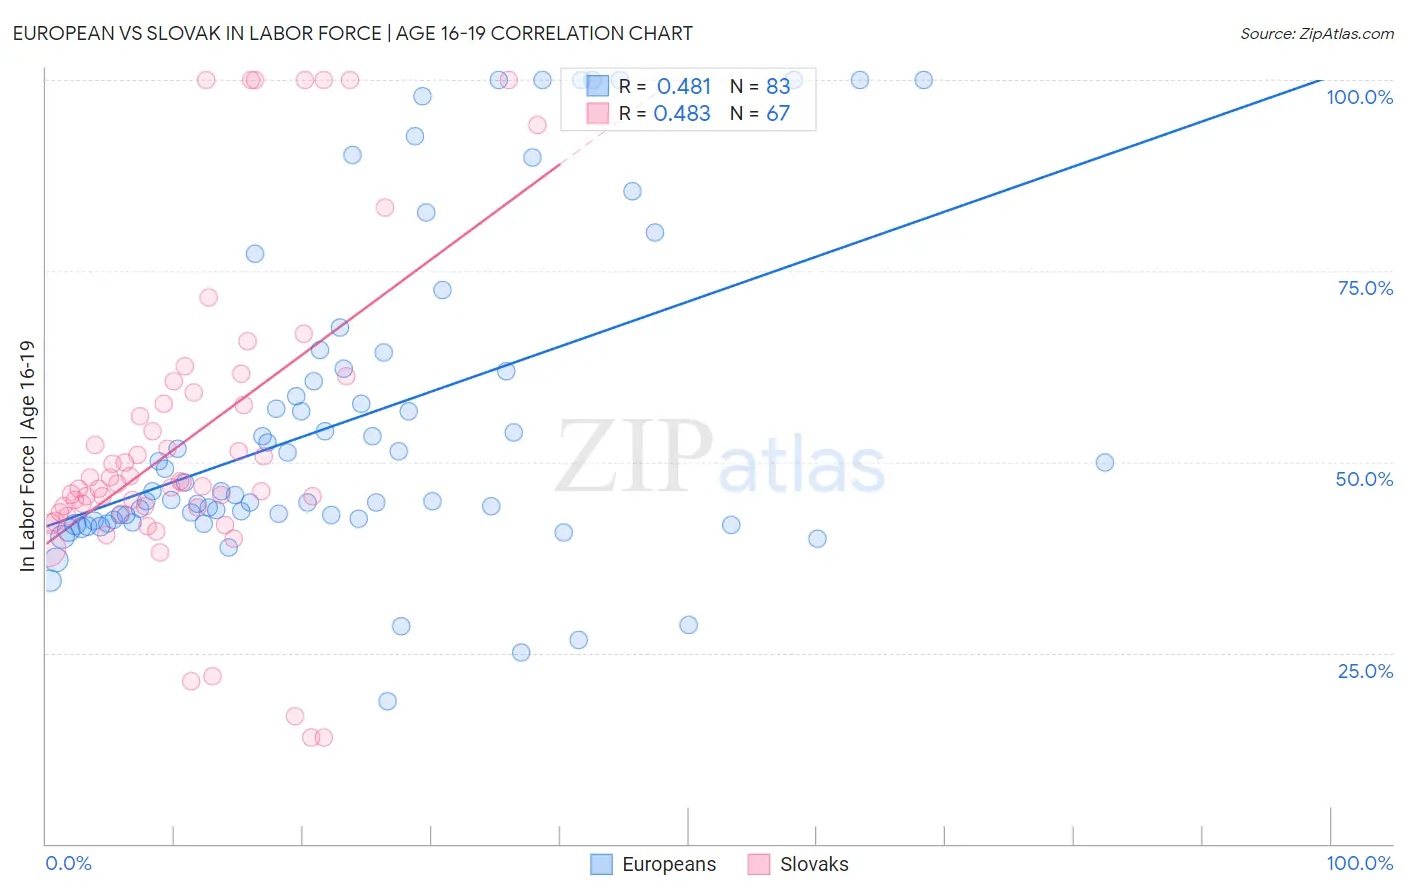
European vs Slovak In Labor Force | Age 16-19 Correlation Chart
The statistical analysis conducted on geographies consisting of 558,493,487 people shows a moderate positive correlation between the proportion of Europeans and labor force participation rate among population between the ages 16 and 19 in the United States with a correlation coefficient (R) of 0.481 and weighted average of 41.1%. Similarly, the statistical analysis conducted on geographies consisting of 396,947,600 people shows a moderate positive correlation between the proportion of Slovaks and labor force participation rate among population between the ages 16 and 19 in the United States with a correlation coefficient (R) of 0.483 and weighted average of 42.6%, a difference of 3.6%.
In Labor Force | Age 16-19 Correlation Summary
| Measurement | European | Slovak |
| Minimum | 18.6% | 13.9% |
| Maximum | 100.0% | 100.0% |
| Range | 81.4% | 86.1% |
| Mean | 55.4% | 53.2% |
| Median | 46.1% | 47.1% |
| Interquartile 25% (IQ1) | 42.3% | 43.4% |
| Interquartile 75% (IQ3) | 62.2% | 59.1% |
| Interquartile Range (IQR) | 20.0% | 15.7% |
| Standard Deviation (Sample) | 21.0% | 20.7% |
| Standard Deviation (Population) | 20.9% | 20.6% |
Similar Demographics by In Labor Force | Age 16-19
Demographics Similar to Europeans by In Labor Force | Age 16-19
In terms of in labor force | age 16-19, the demographic groups most similar to Europeans are Croatian (41.1%, a difference of 0.040%), Tongan (41.2%, a difference of 0.10%), Immigrants from Sudan (41.0%, a difference of 0.36%), White/Caucasian (41.3%, a difference of 0.41%), and Celtic (41.3%, a difference of 0.42%).
| Demographics | Rating | Rank | In Labor Force | Age 16-19 |
| Immigrants | Congo | 100.0 /100 | #37 | Exceptional 41.7% |
| Sioux | 100.0 /100 | #38 | Exceptional 41.5% |
| Scotch-Irish | 100.0 /100 | #39 | Exceptional 41.5% |
| Immigrants | Liberia | 100.0 /100 | #40 | Exceptional 41.5% |
| Celtics | 100.0 /100 | #41 | Exceptional 41.3% |
| Whites/Caucasians | 100.0 /100 | #42 | Exceptional 41.3% |
| Tongans | 100.0 /100 | #43 | Exceptional 41.2% |
| Europeans | 100.0 /100 | #44 | Exceptional 41.1% |
| Croatians | 100.0 /100 | #45 | Exceptional 41.1% |
| Immigrants | Sudan | 100.0 /100 | #46 | Exceptional 41.0% |
| Carpatho Rusyns | 100.0 /100 | #47 | Exceptional 40.8% |
| Icelanders | 100.0 /100 | #48 | Exceptional 40.8% |
| Cree | 100.0 /100 | #49 | Exceptional 40.8% |
| Indonesians | 100.0 /100 | #50 | Exceptional 40.7% |
| Immigrants | Zaire | 100.0 /100 | #51 | Exceptional 40.7% |
Demographics Similar to Slovaks by In Labor Force | Age 16-19
In terms of in labor force | age 16-19, the demographic groups most similar to Slovaks are Bangladeshi (42.5%, a difference of 0.33%), German Russian (42.4%, a difference of 0.41%), English (42.4%, a difference of 0.54%), Sudanese (42.9%, a difference of 0.59%), and Welsh (42.3%, a difference of 0.81%).
| Demographics | Rating | Rank | In Labor Force | Age 16-19 |
| Czechs | 100.0 /100 | #16 | Exceptional 43.6% |
| Scandinavians | 100.0 /100 | #17 | Exceptional 43.6% |
| French Canadians | 100.0 /100 | #18 | Exceptional 43.6% |
| Belgians | 100.0 /100 | #19 | Exceptional 43.4% |
| Swiss | 100.0 /100 | #20 | Exceptional 43.3% |
| Ottawa | 100.0 /100 | #21 | Exceptional 43.0% |
| Sudanese | 100.0 /100 | #22 | Exceptional 42.9% |
| Slovaks | 100.0 /100 | #23 | Exceptional 42.6% |
| Bangladeshis | 100.0 /100 | #24 | Exceptional 42.5% |
| German Russians | 100.0 /100 | #25 | Exceptional 42.4% |
| English | 100.0 /100 | #26 | Exceptional 42.4% |
| Welsh | 100.0 /100 | #27 | Exceptional 42.3% |
| Poles | 100.0 /100 | #28 | Exceptional 42.1% |
| French | 100.0 /100 | #29 | Exceptional 42.1% |
| Scottish | 100.0 /100 | #30 | Exceptional 42.0% |